Lecture 8: Real Gases
0) Orientation, quick review, and assessment guidance
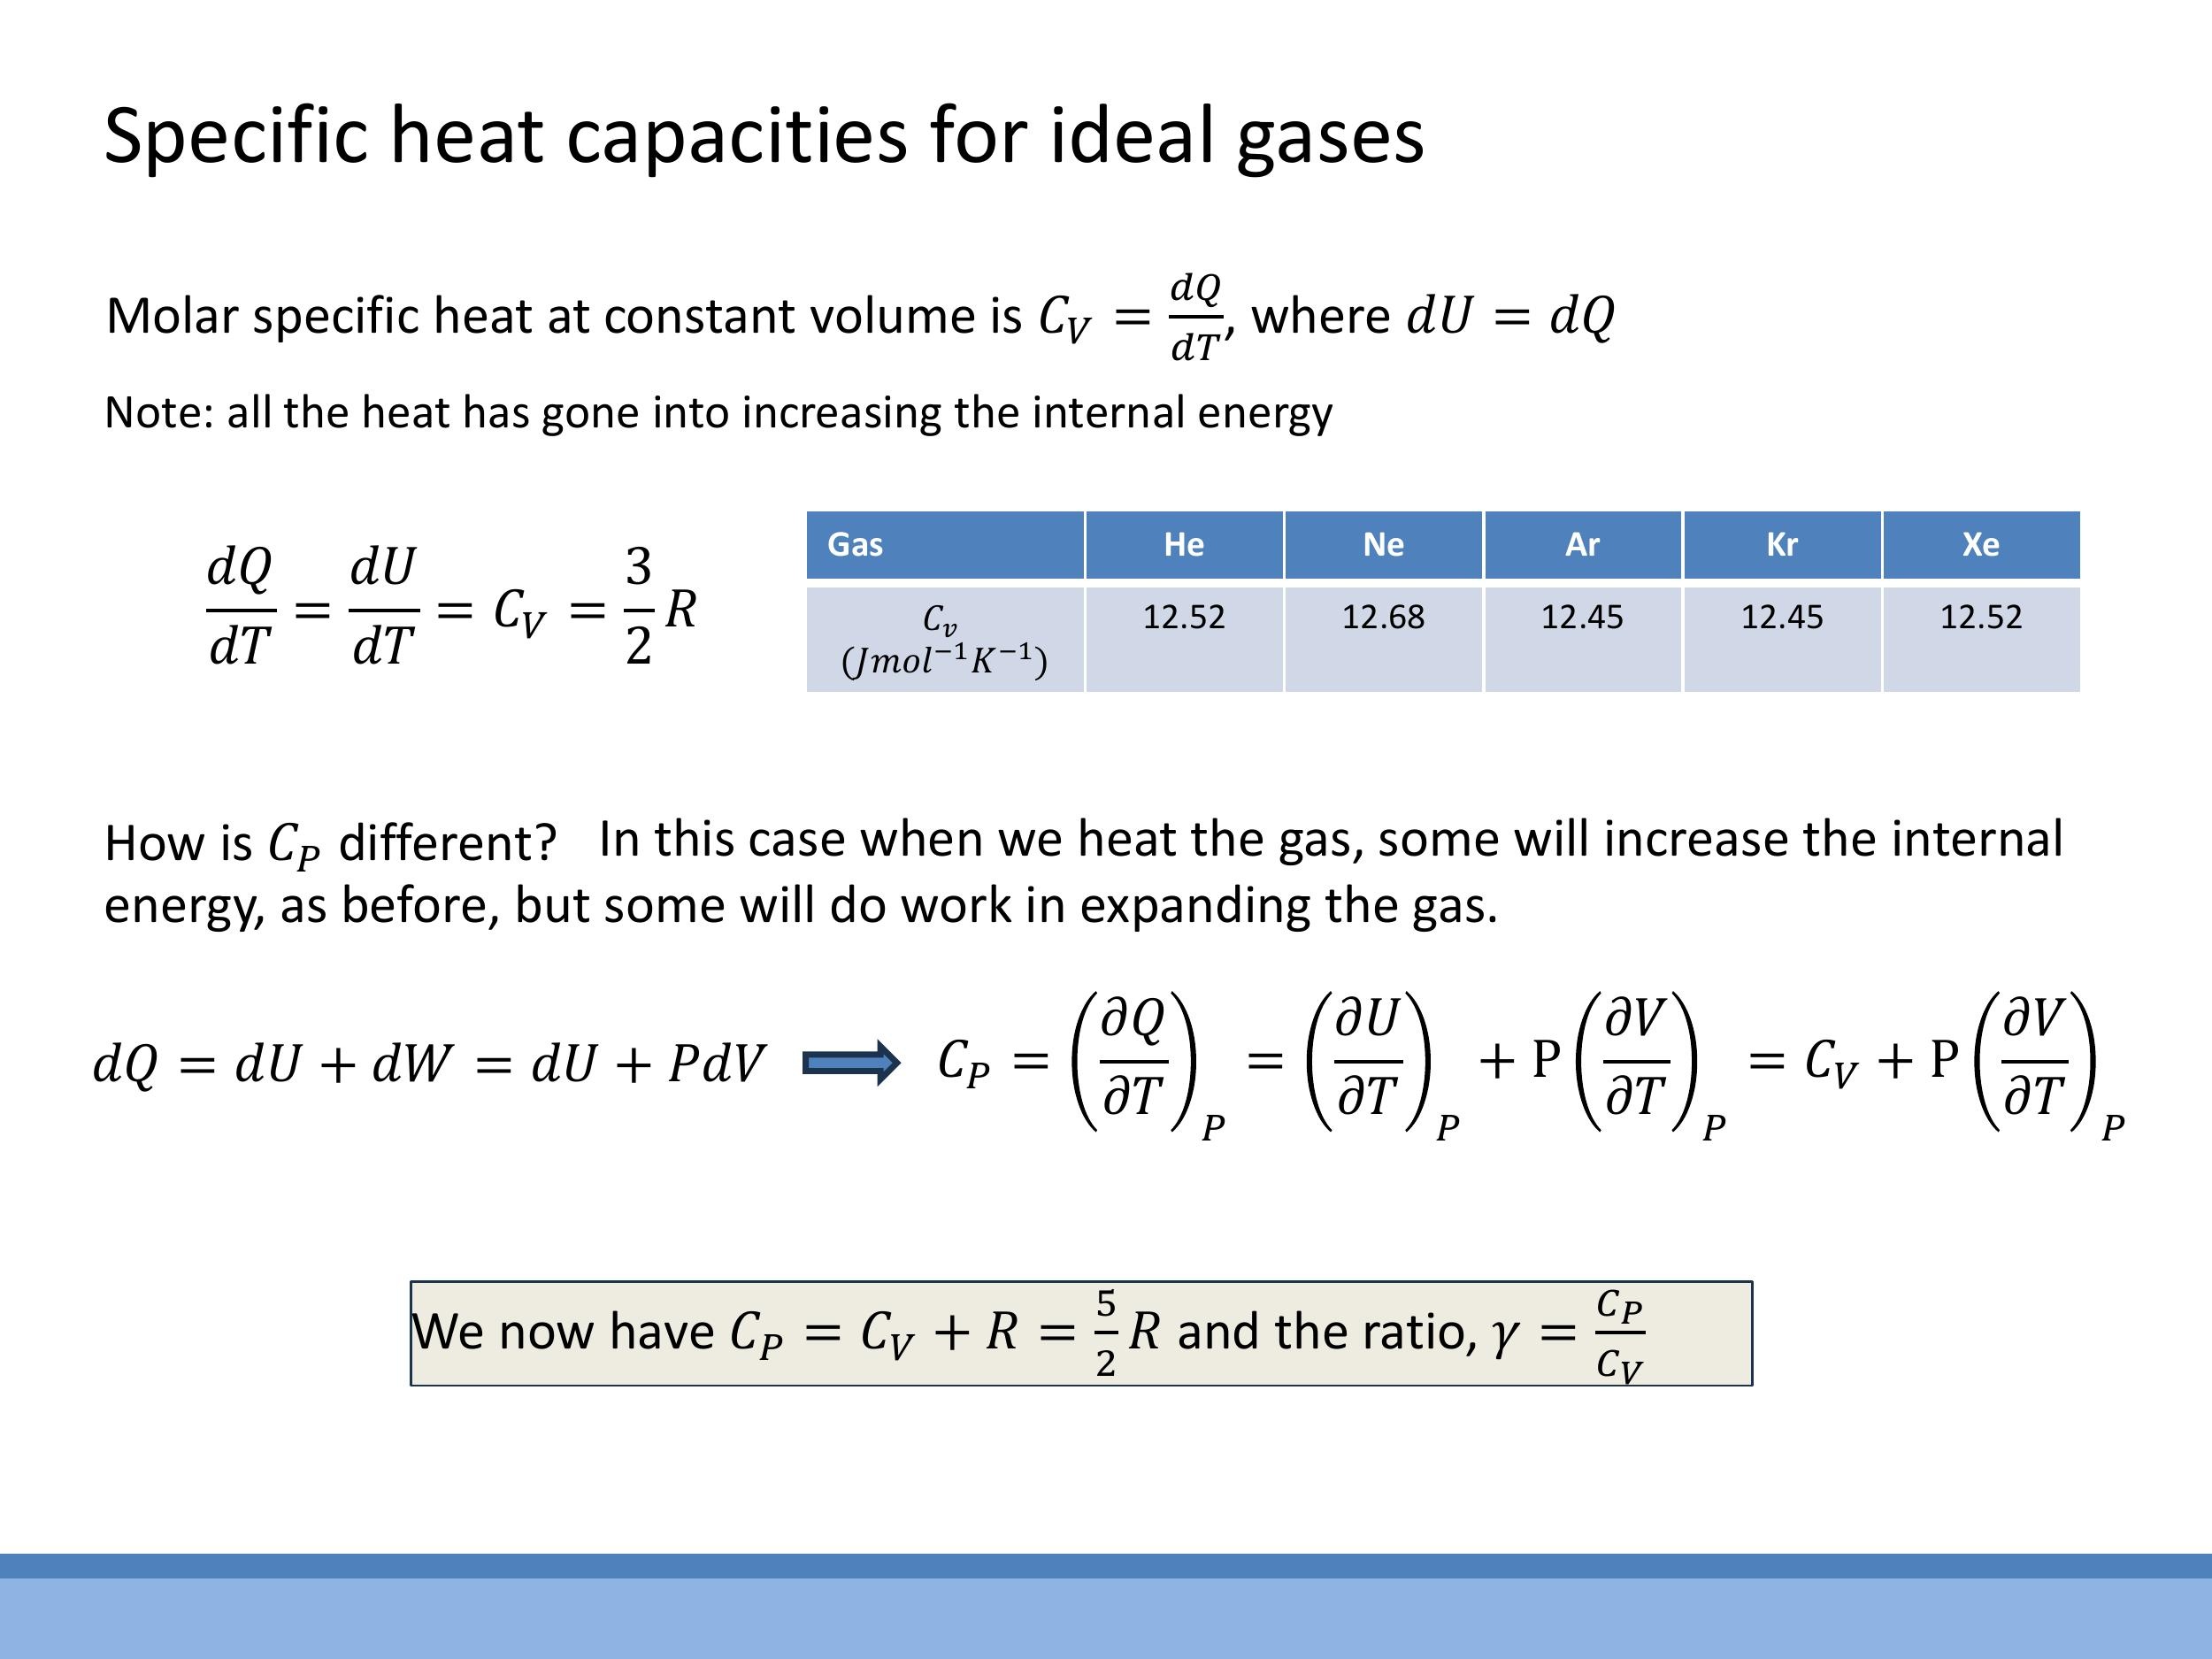
This lecture builds upon the previous discussion of specific heat capacities for ideal gases. For a monatomic ideal gas, the equipartition theorem dictates an average molar internal energy of $\frac{3}{2}RT$, leading to a molar specific heat at constant volume, $C_V = \frac{3}{2}R$. The molar specific heat at constant pressure, $C_P$, is related by Mayer's relation, $C_P = C_V + R = \frac{5}{2}R$. Consequently, the ratio of specific heats, $\gamma = \frac{C_P}{C_V} = \frac{5}{3}$. Noble gases experimentally exhibit $C_V$ values very close to $\frac{3}{2}R$, confirming their near-ideal behaviour. Today's focus is to understand why the ideal gas assumptions fail for real gases and how these failures are addressed through models like the van der Waals equation and the virial form. We will explore how isotherms reveal phase changes, introduce the critical point, and define supercritical fluids. For assessment purposes, complex real-gas formulae and numerical values will be provided; the emphasis will be on recognizing the underlying physics and performing straightforward substitutions to derive numerical results.
1) What breaks in the ideal gas model, and what does it change?
The ideal gas model relies on two primary idealizations that break down for real gases. Firstly, it assumes no intermolecular forces, implying particles do not interact. In reality, gas molecules experience both attractive and short-range repulsive forces. Secondly, the model treats particles as point-like entities with negligible volume. In physical systems, atoms and molecules possess finite size.
These failing assumptions have significant consequences for the macroscopic state variables of a gas. For pressure, intermolecular attractive forces reduce the momentum transferred to the container walls. Molecules near the wall experience a net inward pull from their neighbours in the bulk, causing them to strike the wall with less force than they would in the absence of attraction. This results in a measured pressure ($P$) that is lower than the theoretical pressure of an ideal gas under similar conditions. For volume, the finite size of molecules means that the actual space available for molecular motion is less than the total container volume ($V$). This "excluded volume" effect necessitates replacing the total volume with an effective available volume that is smaller than the container volume.
2) Modelling real gases: van der Waals and the virial view
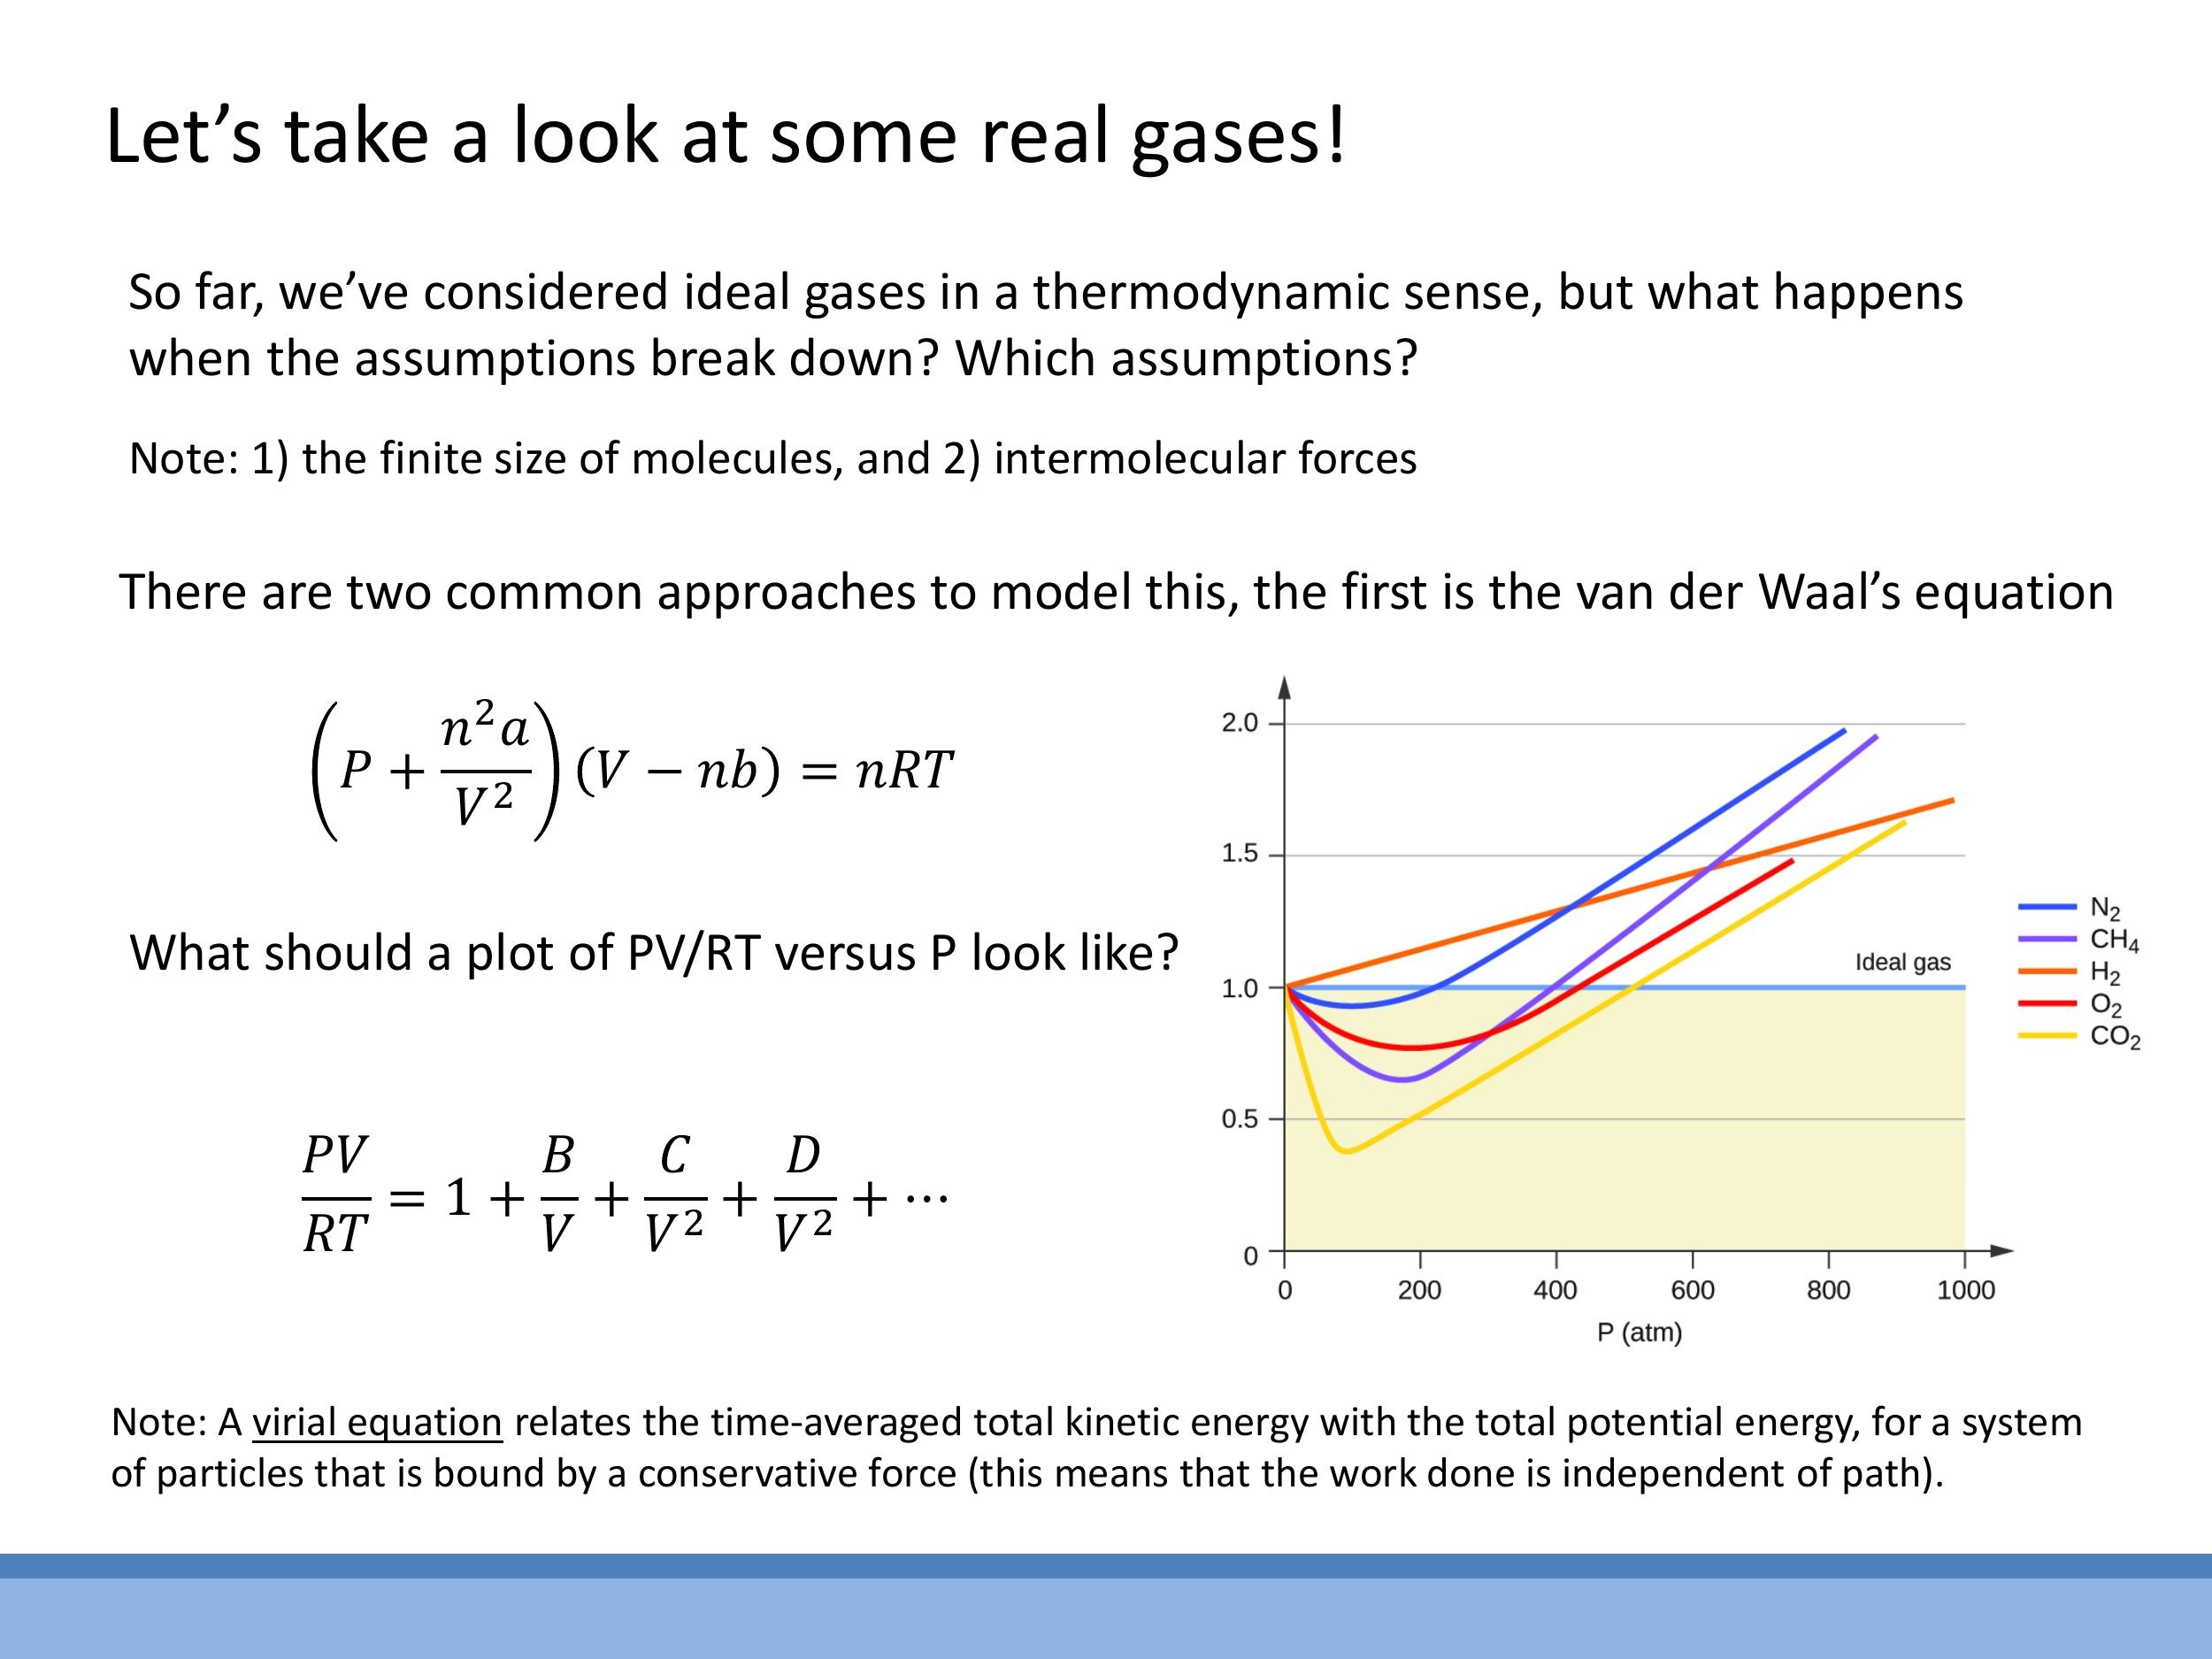
The van der Waals (vdW) equation provides a physically intuitive model for real gases by introducing corrections to the ideal gas law:
$$
\left( P + \frac{n^2 a}{V^2} \right) (V - nb) = nRT
$$
Here, the term $\frac{n^2 a}{V^2}$ corrects for intermolecular attraction by increasing the effective pressure, while the term $nb$ corrects for the finite size of molecules by reducing the available volume. For context, the virial equation offers an empirical alternative, expressed as a power series expansion:
$$
\frac{PV}{RT} = 1 + \frac{B}{V} + \frac{C}{V^2} + \dots
$$
The coefficients $B$, $C$, and so on are determined by fitting to experimental data. This series approaches 1 as the volume ($V$) tends to infinity, indicating ideal gas behaviour at low densities.
Experimental data for real gases, when plotted as $\frac{PV}{RT}$ versus $P$ (for one mole), reveal significant deviations from the ideal gas value of 1. At low pressures, real gases approximate ideal behaviour, but at higher pressures (and lower temperatures), intermolecular forces and finite molecular size become dominant, causing $\frac{PV}{RT}$ to deviate. Different gases exhibit distinct deviation curves. Both the van der Waals and virial equations correctly predict that at low densities (high $V$) or high temperatures ($T$), the correction terms become negligible, and the equations reduce to the ideal gas law, $PV = nRT$.
3) Finite-size correction (b): the excluded volume
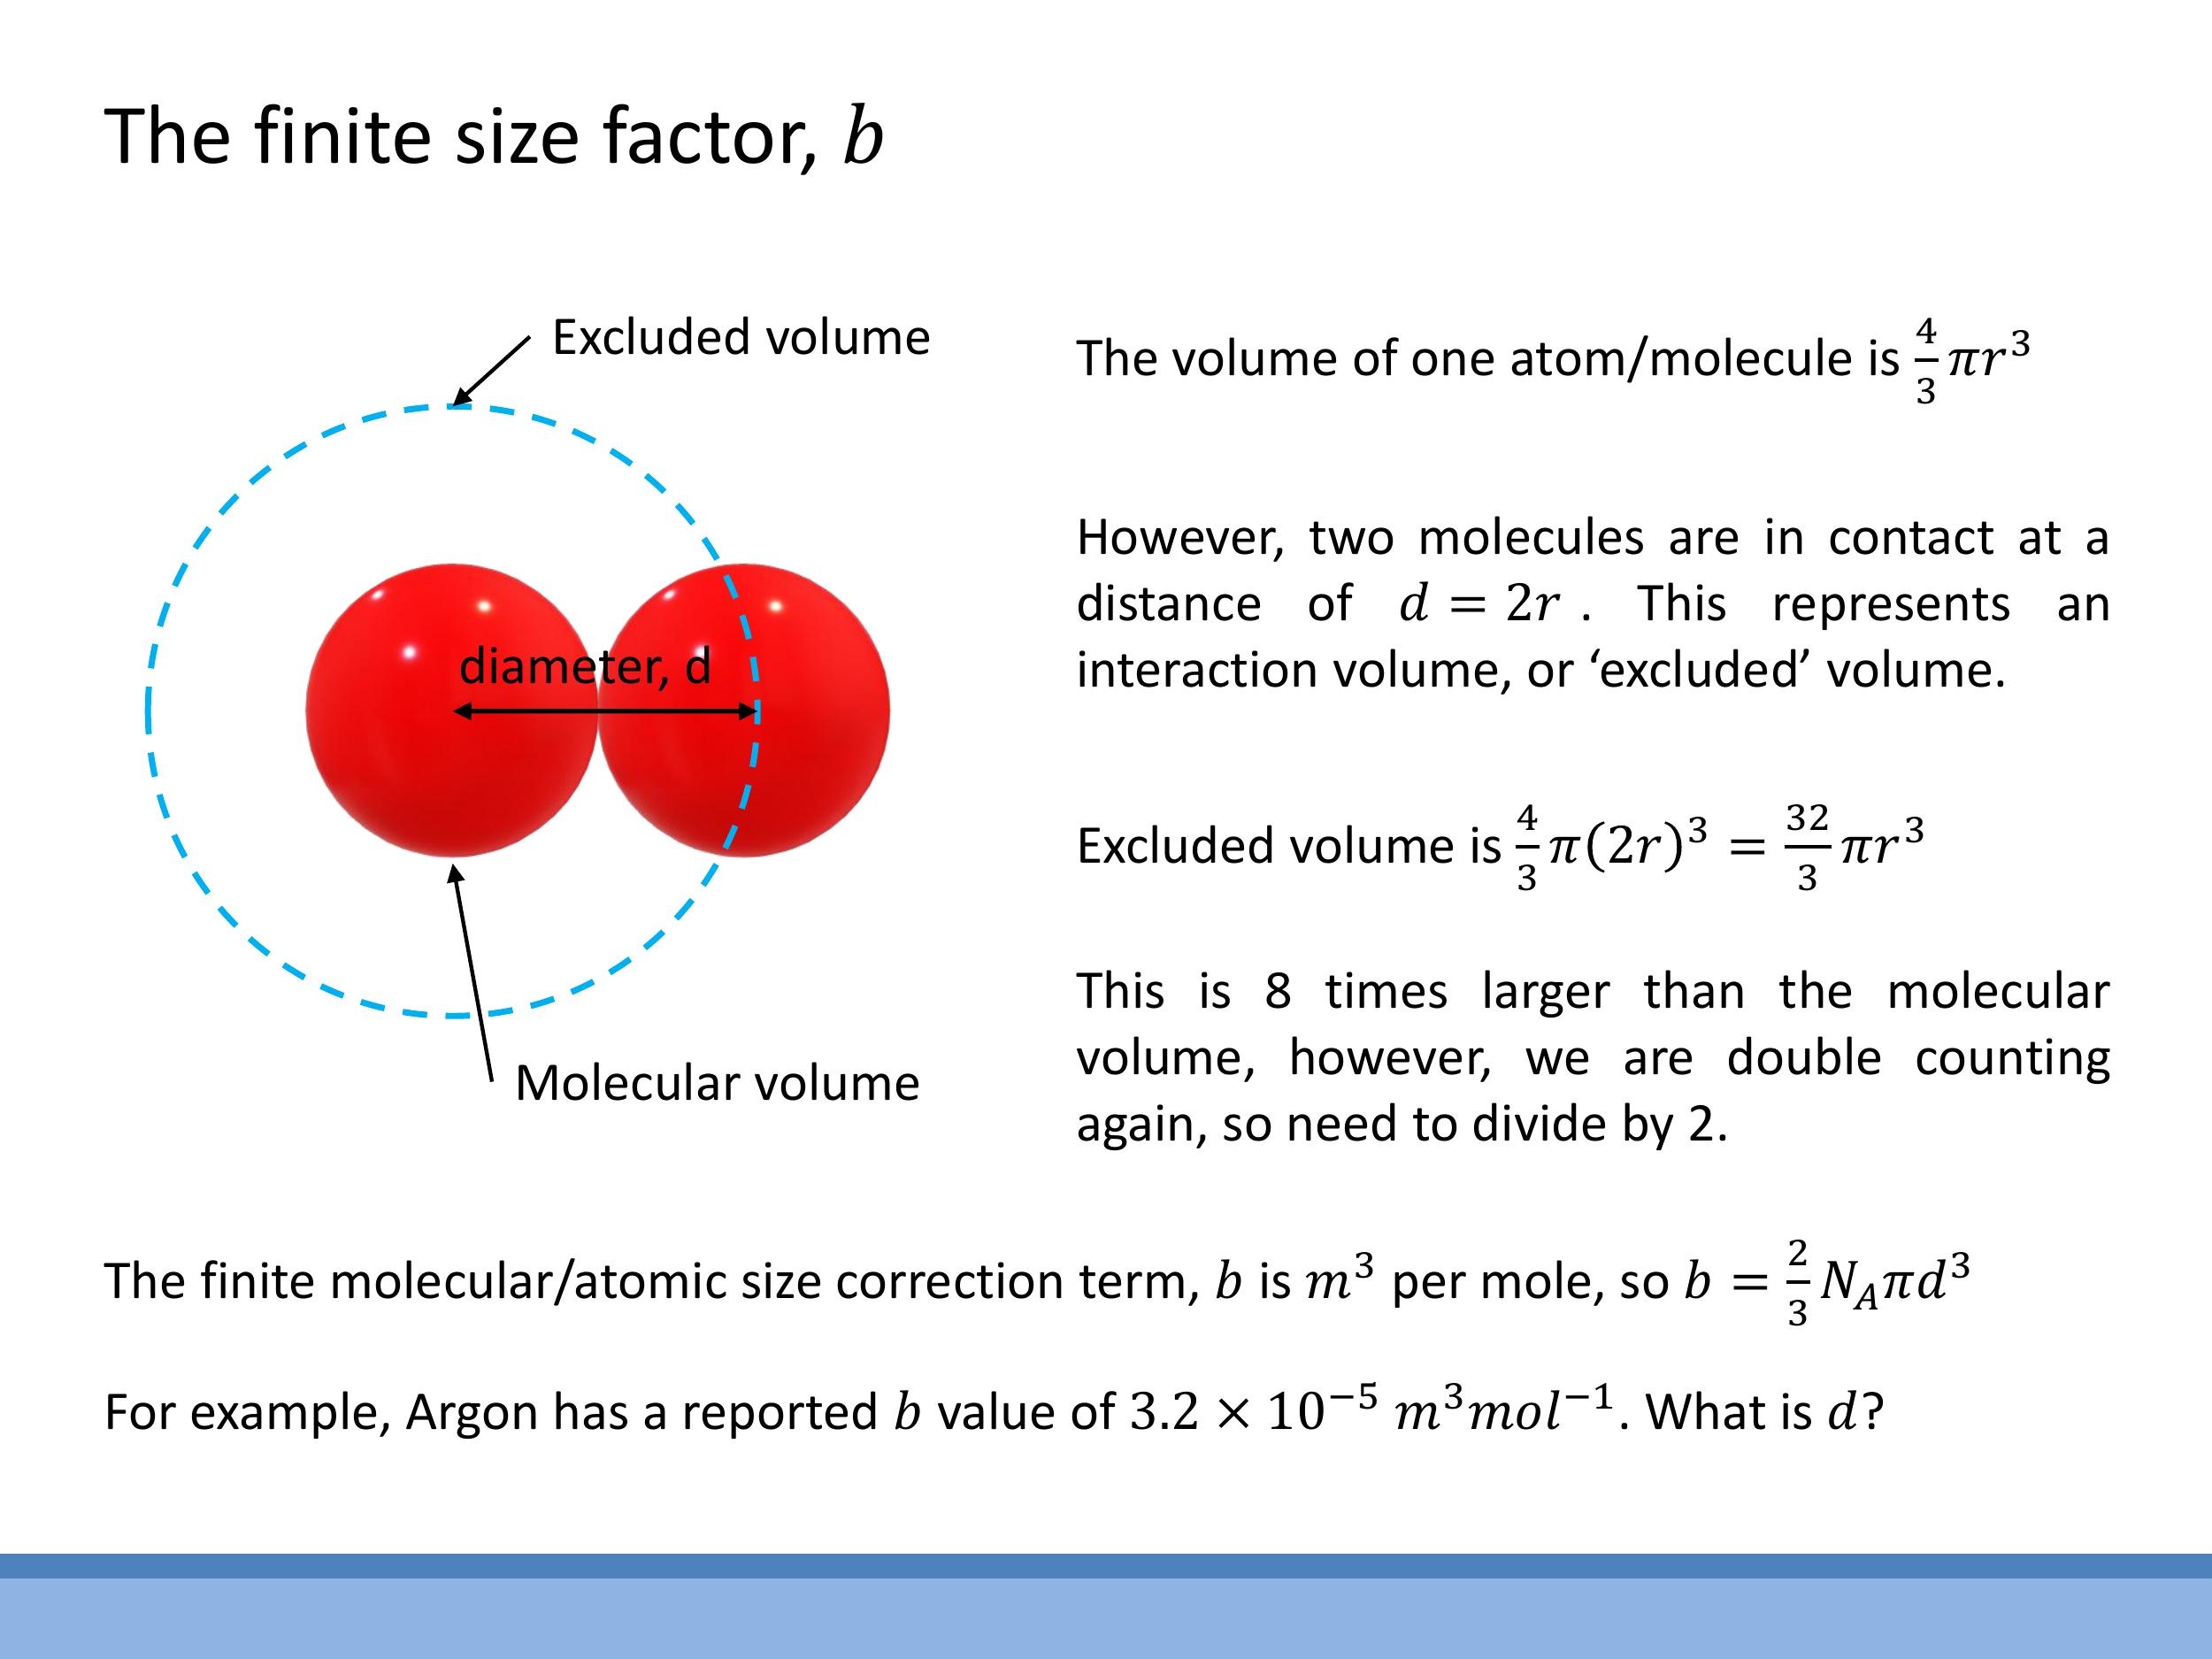
The finite-size correction term, $b$, accounts for the volume occupied by the gas molecules themselves, effectively reducing the available volume for other molecules to move in. This can be conceptualized by treating molecules as hard spheres of diameter $d$. When two such spheres are in contact, the centre of one molecule cannot enter a spherical region of radius $d$ around the centre of the other. This volume represents the "excluded volume" for a pair of molecules.
To calculate $b$ per mole, the excluded volume for a single pair is $\frac{4}{3}\pi d^3$. However, since each excluded volume is shared between two interacting molecules, a factor of $\frac{1}{2}$ is introduced to avoid double-counting. Thus, the excluded volume per molecule is $\frac{1}{2} \times \frac{4}{3}\pi d^3 = \frac{2}{3}\pi d^3$. Multiplying this by Avogadro's number ($N_A$) yields the molar correction term:
$$
b = \frac{2}{3} N_A \pi d^3
$$
The units of $b$ are typically $\text{m}^3 \, \text{mol}^{-1} $. For example, Argon has a reported $ b $ value of approximately $ 3.2 \times 10^{-5} \, \text{m}^3 \, \text{mol}^{-1} $. This term underpins the intuition that the actual free volume for molecular motion is $ V - nb $, where $ nb $ is the total volume inaccessible due to the finite size of $ n$ moles of gas.
4) Attraction correction (a): why the wall pressure is lower
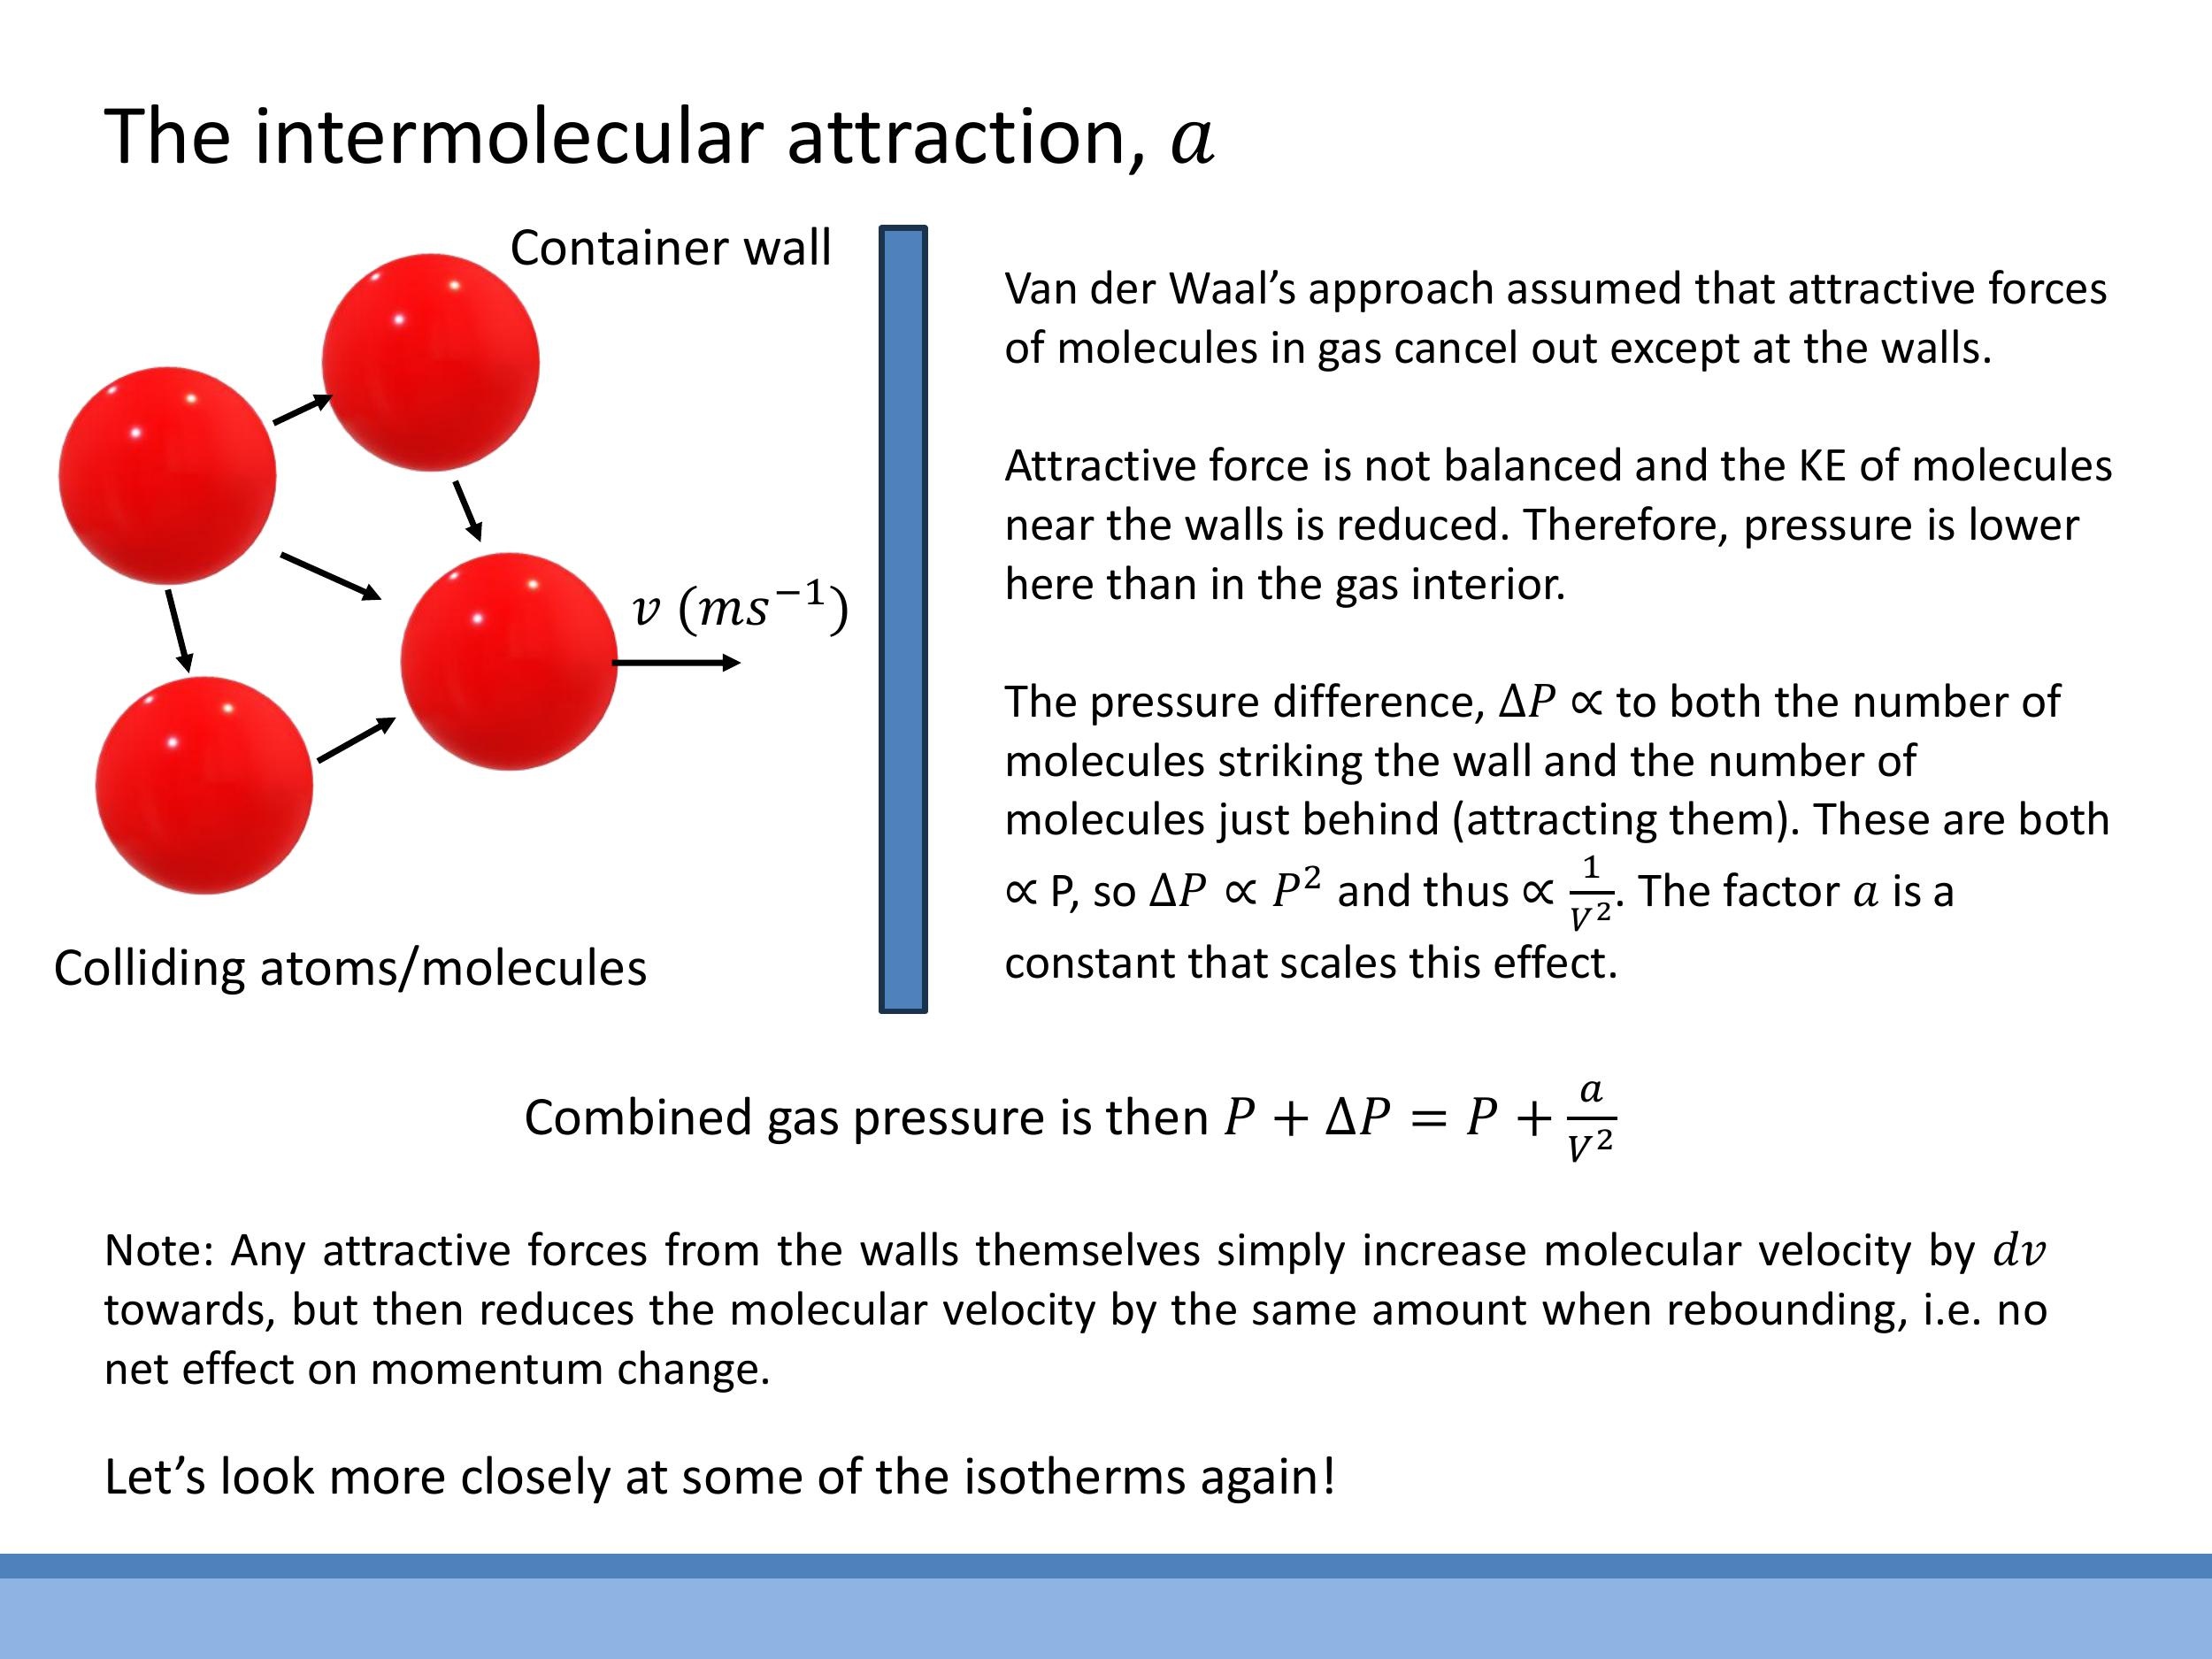
The correction term $a$ in the van der Waals equation accounts for the attractive intermolecular forces that reduce the measured pressure exerted by a real gas. In the bulk of the gas, the attractive forces experienced by any given molecule from its neighbours tend to cancel out in all directions. However, a molecule approaching the container wall experiences a net inward pull from the molecules behind it, as there are no molecules beyond the wall to exert an opposing attractive force. This net inward force reduces the momentum with which the molecule strikes the wall.
The reduction in pressure, $\Delta P$, is proportional to two factors: the number density of molecules hitting the wall, and the number density of molecules in the bulk exerting the attractive pull. Both of these are proportional to the number density of the gas, $\frac{n}{V}$. Therefore, the pressure reduction scales quadratically with density: $\Delta P \propto \left(\frac{n}{V}\right)^2$. This justifies the van der Waals pressure correction, where the measured pressure $P$ is effectively increased by $a\left(\frac{n}{V}\right)^2$ to represent the ideal pressure, leading to the term $P + a\left(\frac{n}{V}\right)^2$. The constant $a$ scales the magnitude of this attractive effect for a specific gas.
5) Reading P-V isotherms: ideal vs real, and what “loops” really mean
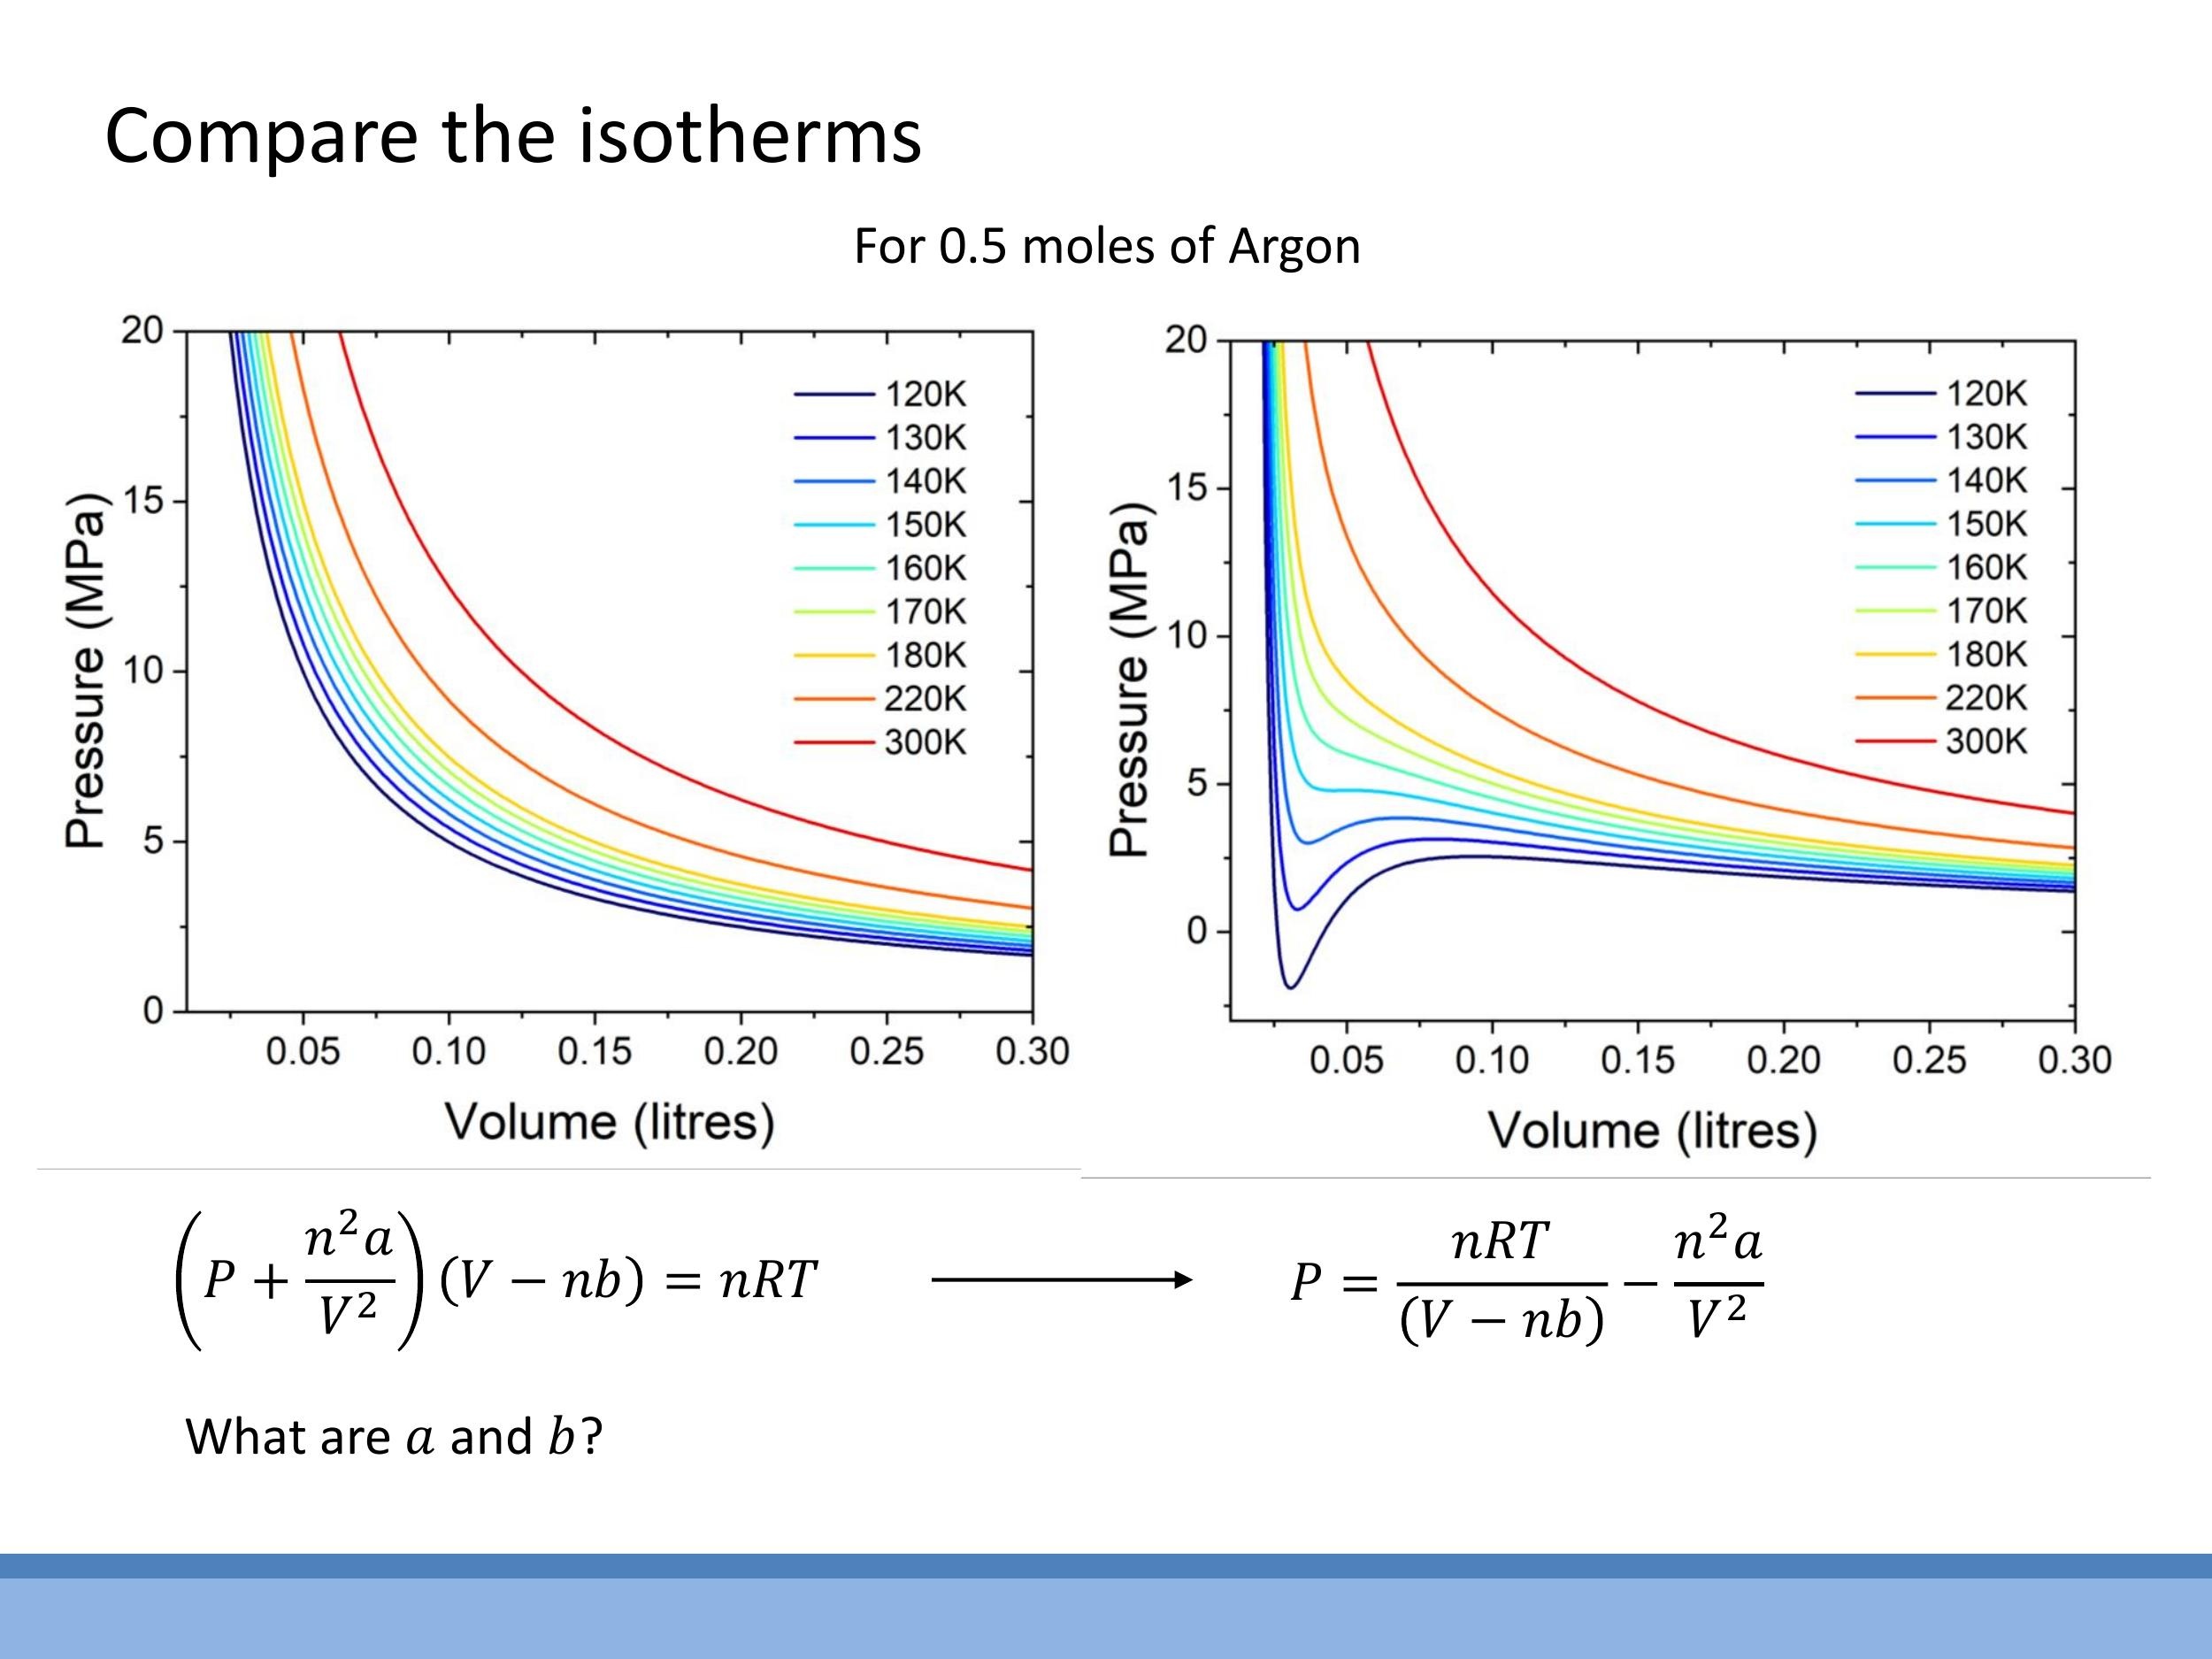
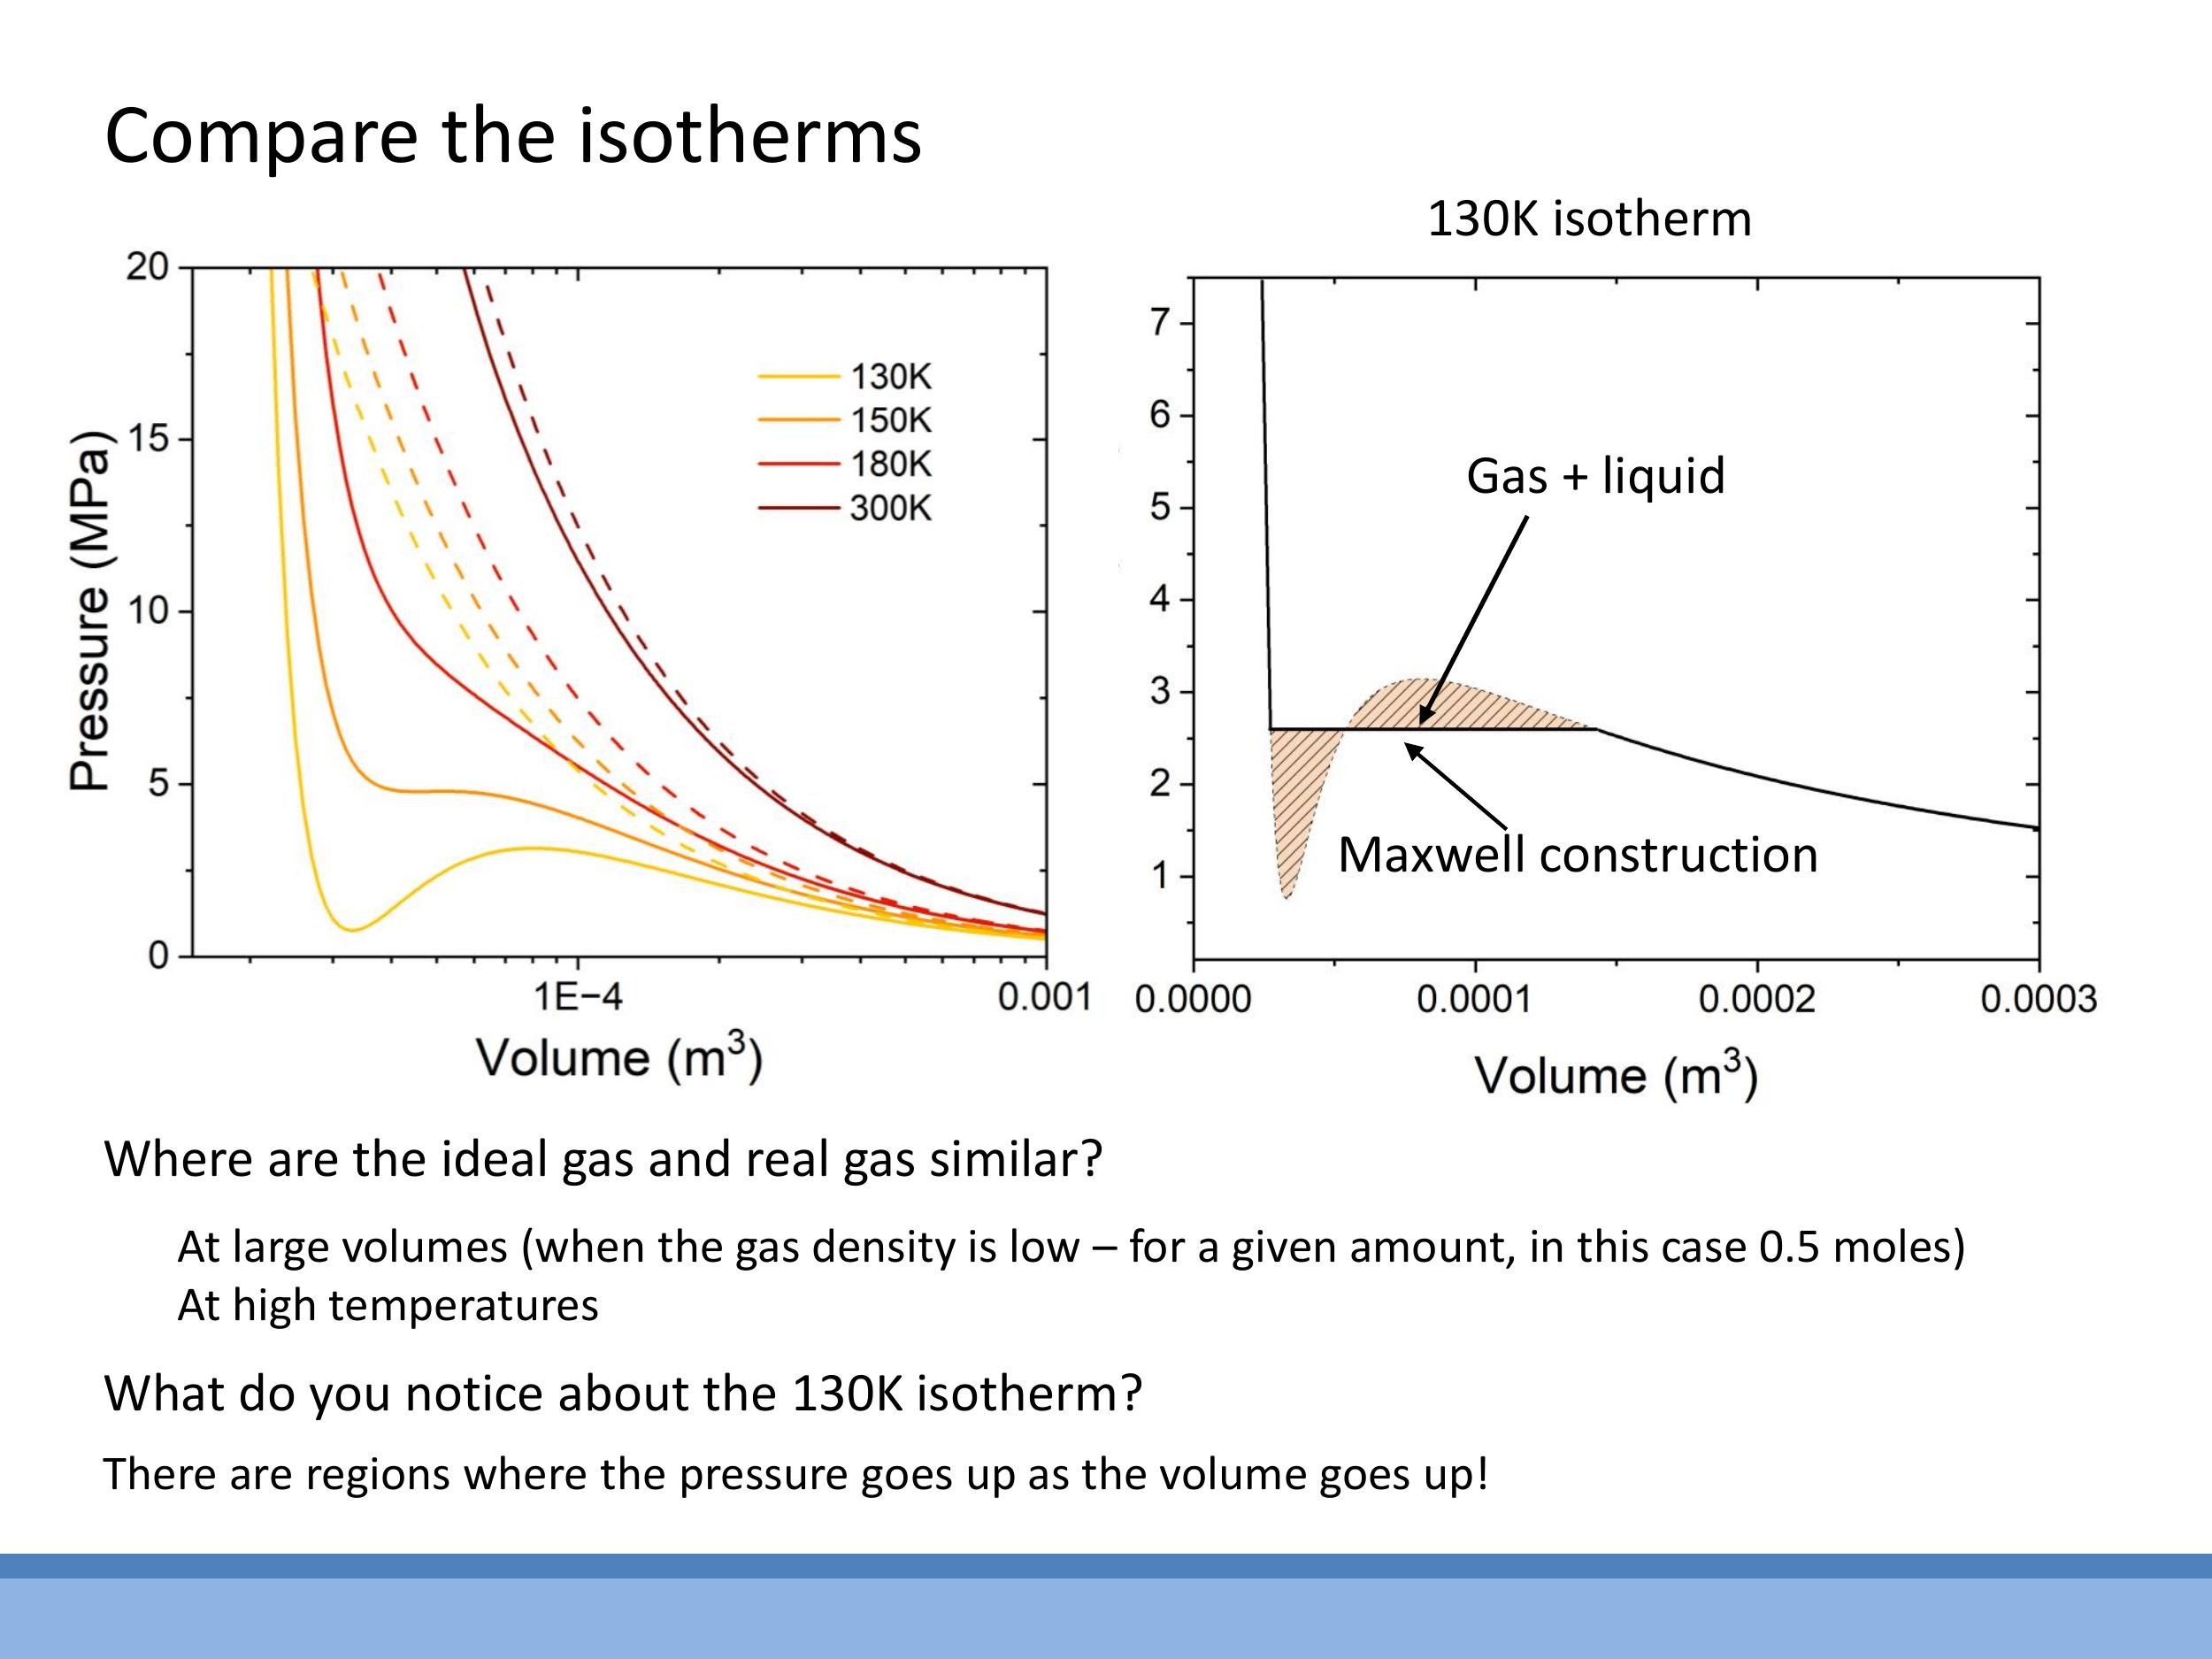
Pressure-Volume ($P$ - $V$) isotherms illustrate the relationship between pressure and volume at a constant temperature. For ideal gases, these isotherms are smooth hyperbolae. However, van der Waals isotherms for real gases deviate significantly, especially at lower temperatures. At high temperatures, real-gas isotherms resemble ideal-gas curves. As the temperature decreases, van der Waals isotherms develop a characteristic S-shaped loop, which includes regions where $\frac{dP}{dV} > 0$ (pressure increases with volume) or even negative pressure, both of which are physically impossible for a single gaseous phase.
This unphysical loop signals the onset of a phase change, specifically condensation from gas to liquid. Within this region, the substance exists as a mixture of gas and liquid in equilibrium. Instead of representing a gas with increasing pressure upon expansion, the loop corresponds to compression at a fixed temperature, where gas converts into liquid at a constant pressure. On the small-volume side of the isotherm, the curve becomes very steep, reflecting the near-incompressibility of the liquid phase.
To resolve the unphysical loop, the Maxwell construction (or equal-area rule) is applied. This replaces the S-shaped portion of the isotherm with a horizontal line, or plateau, at the phase-change pressure. The position of this line is chosen such that the area between the van der Waals curve and the horizontal line above the plateau is equal to the area below it. This corrected isotherm then clearly delineates three regions: the gas phase at large volumes (following the van der Waals curve), the gas-liquid coexistence region at constant pressure (the flat plateau), and the liquid phase at small volumes (exhibiting a very steep pressure rise due to incompressibility). Condensation is favoured at low temperatures, which is why the loop becomes more pronounced, whereas high temperatures "wash out" this behaviour, leading to ideal-like isotherms.
6) The critical isotherm and the scale $T_C \sim \varepsilon/k$
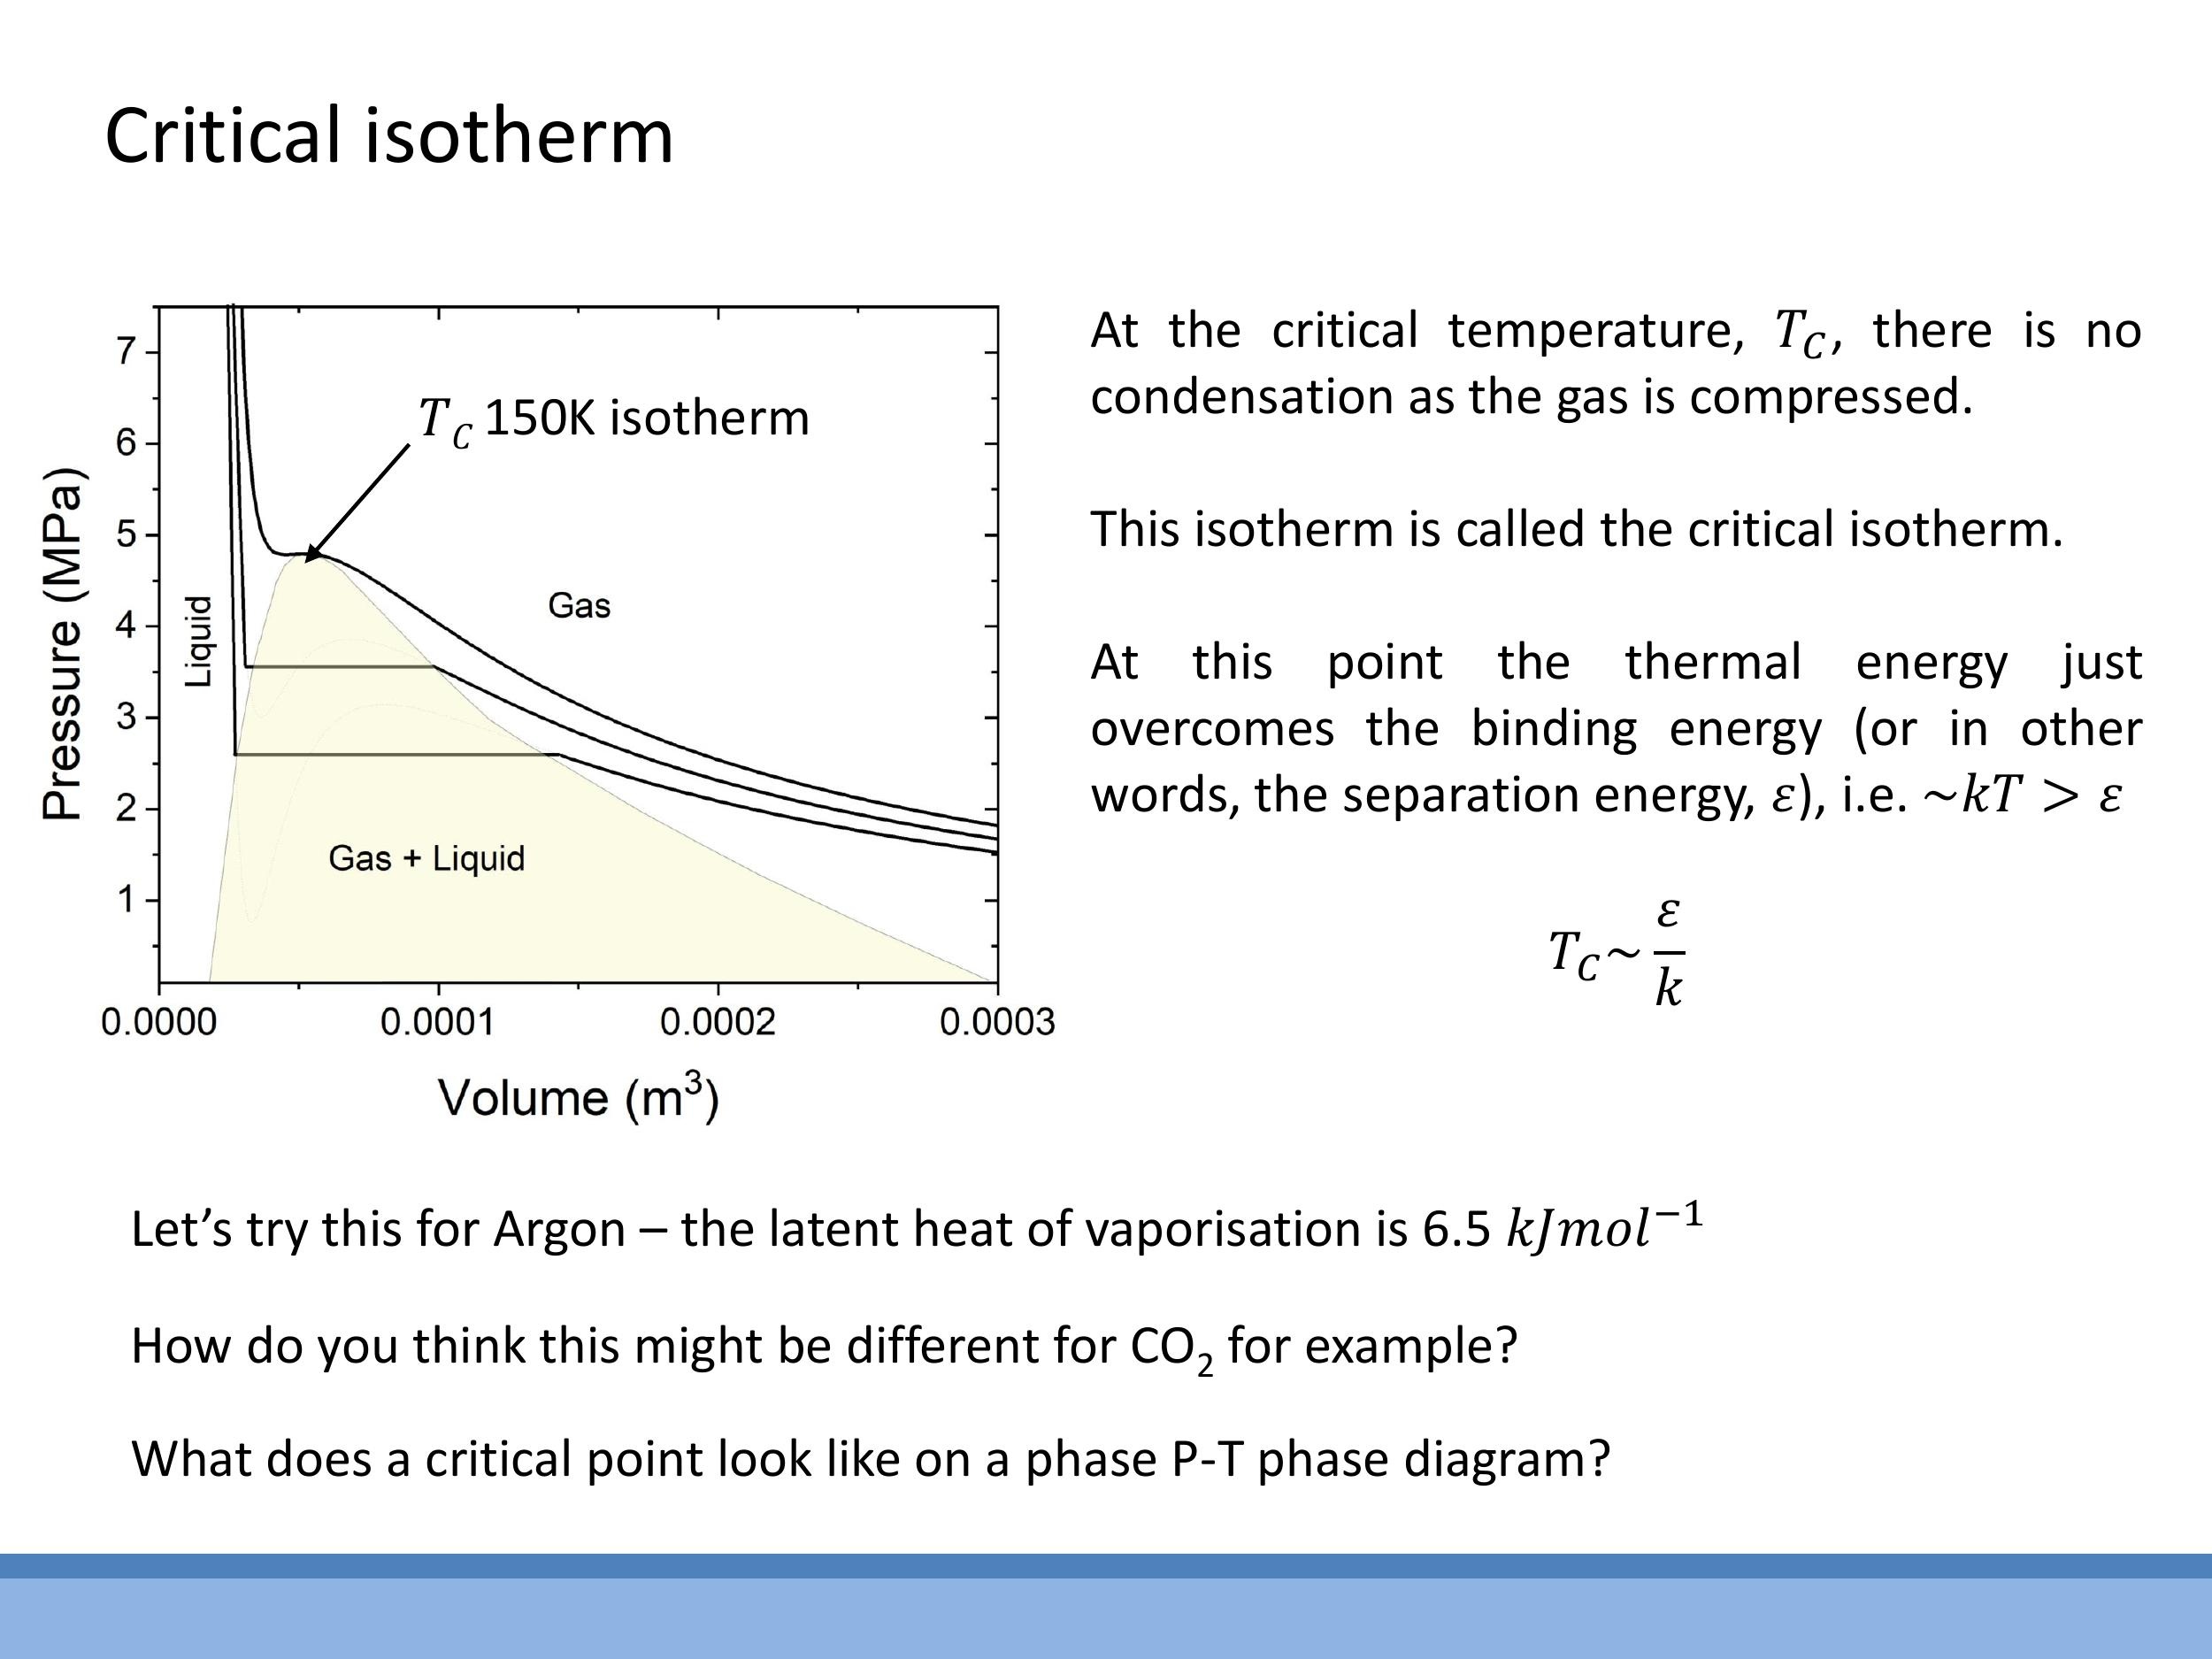
As temperature increases, the unphysical S-shaped loop on the van der Waals isotherms progressively shrinks. At a specific temperature, known as the critical temperature ($T_C$), the loop disappears entirely, collapsing into a single point of inflection with a horizontal tangent. This unique isotherm is called the critical isotherm
The critical temperature provides a crucial link between macroscopic thermodynamic behaviour and microscopic intermolecular forces. At $T_C$, the average thermal energy of the molecules, $kT$, becomes comparable to the intermolecular binding or separation energy, $\varepsilon$. This relationship can be expressed as $T_C \sim \frac{\varepsilon}{k}$. This connection reinforces earlier concepts where $\varepsilon$ was inferred from latent heats and neighbour counting, demonstrating that the same energy scale governs both microscopic bond strength and the macroscopic critical point. The P-V diagram clearly shows the gas, coexistence, and liquid regions relative to this critical isotherm, with the critical point marking the end of the gas-liquid phase boundary.
7) Phase diagrams: triple point, critical point, and supercritical fluids
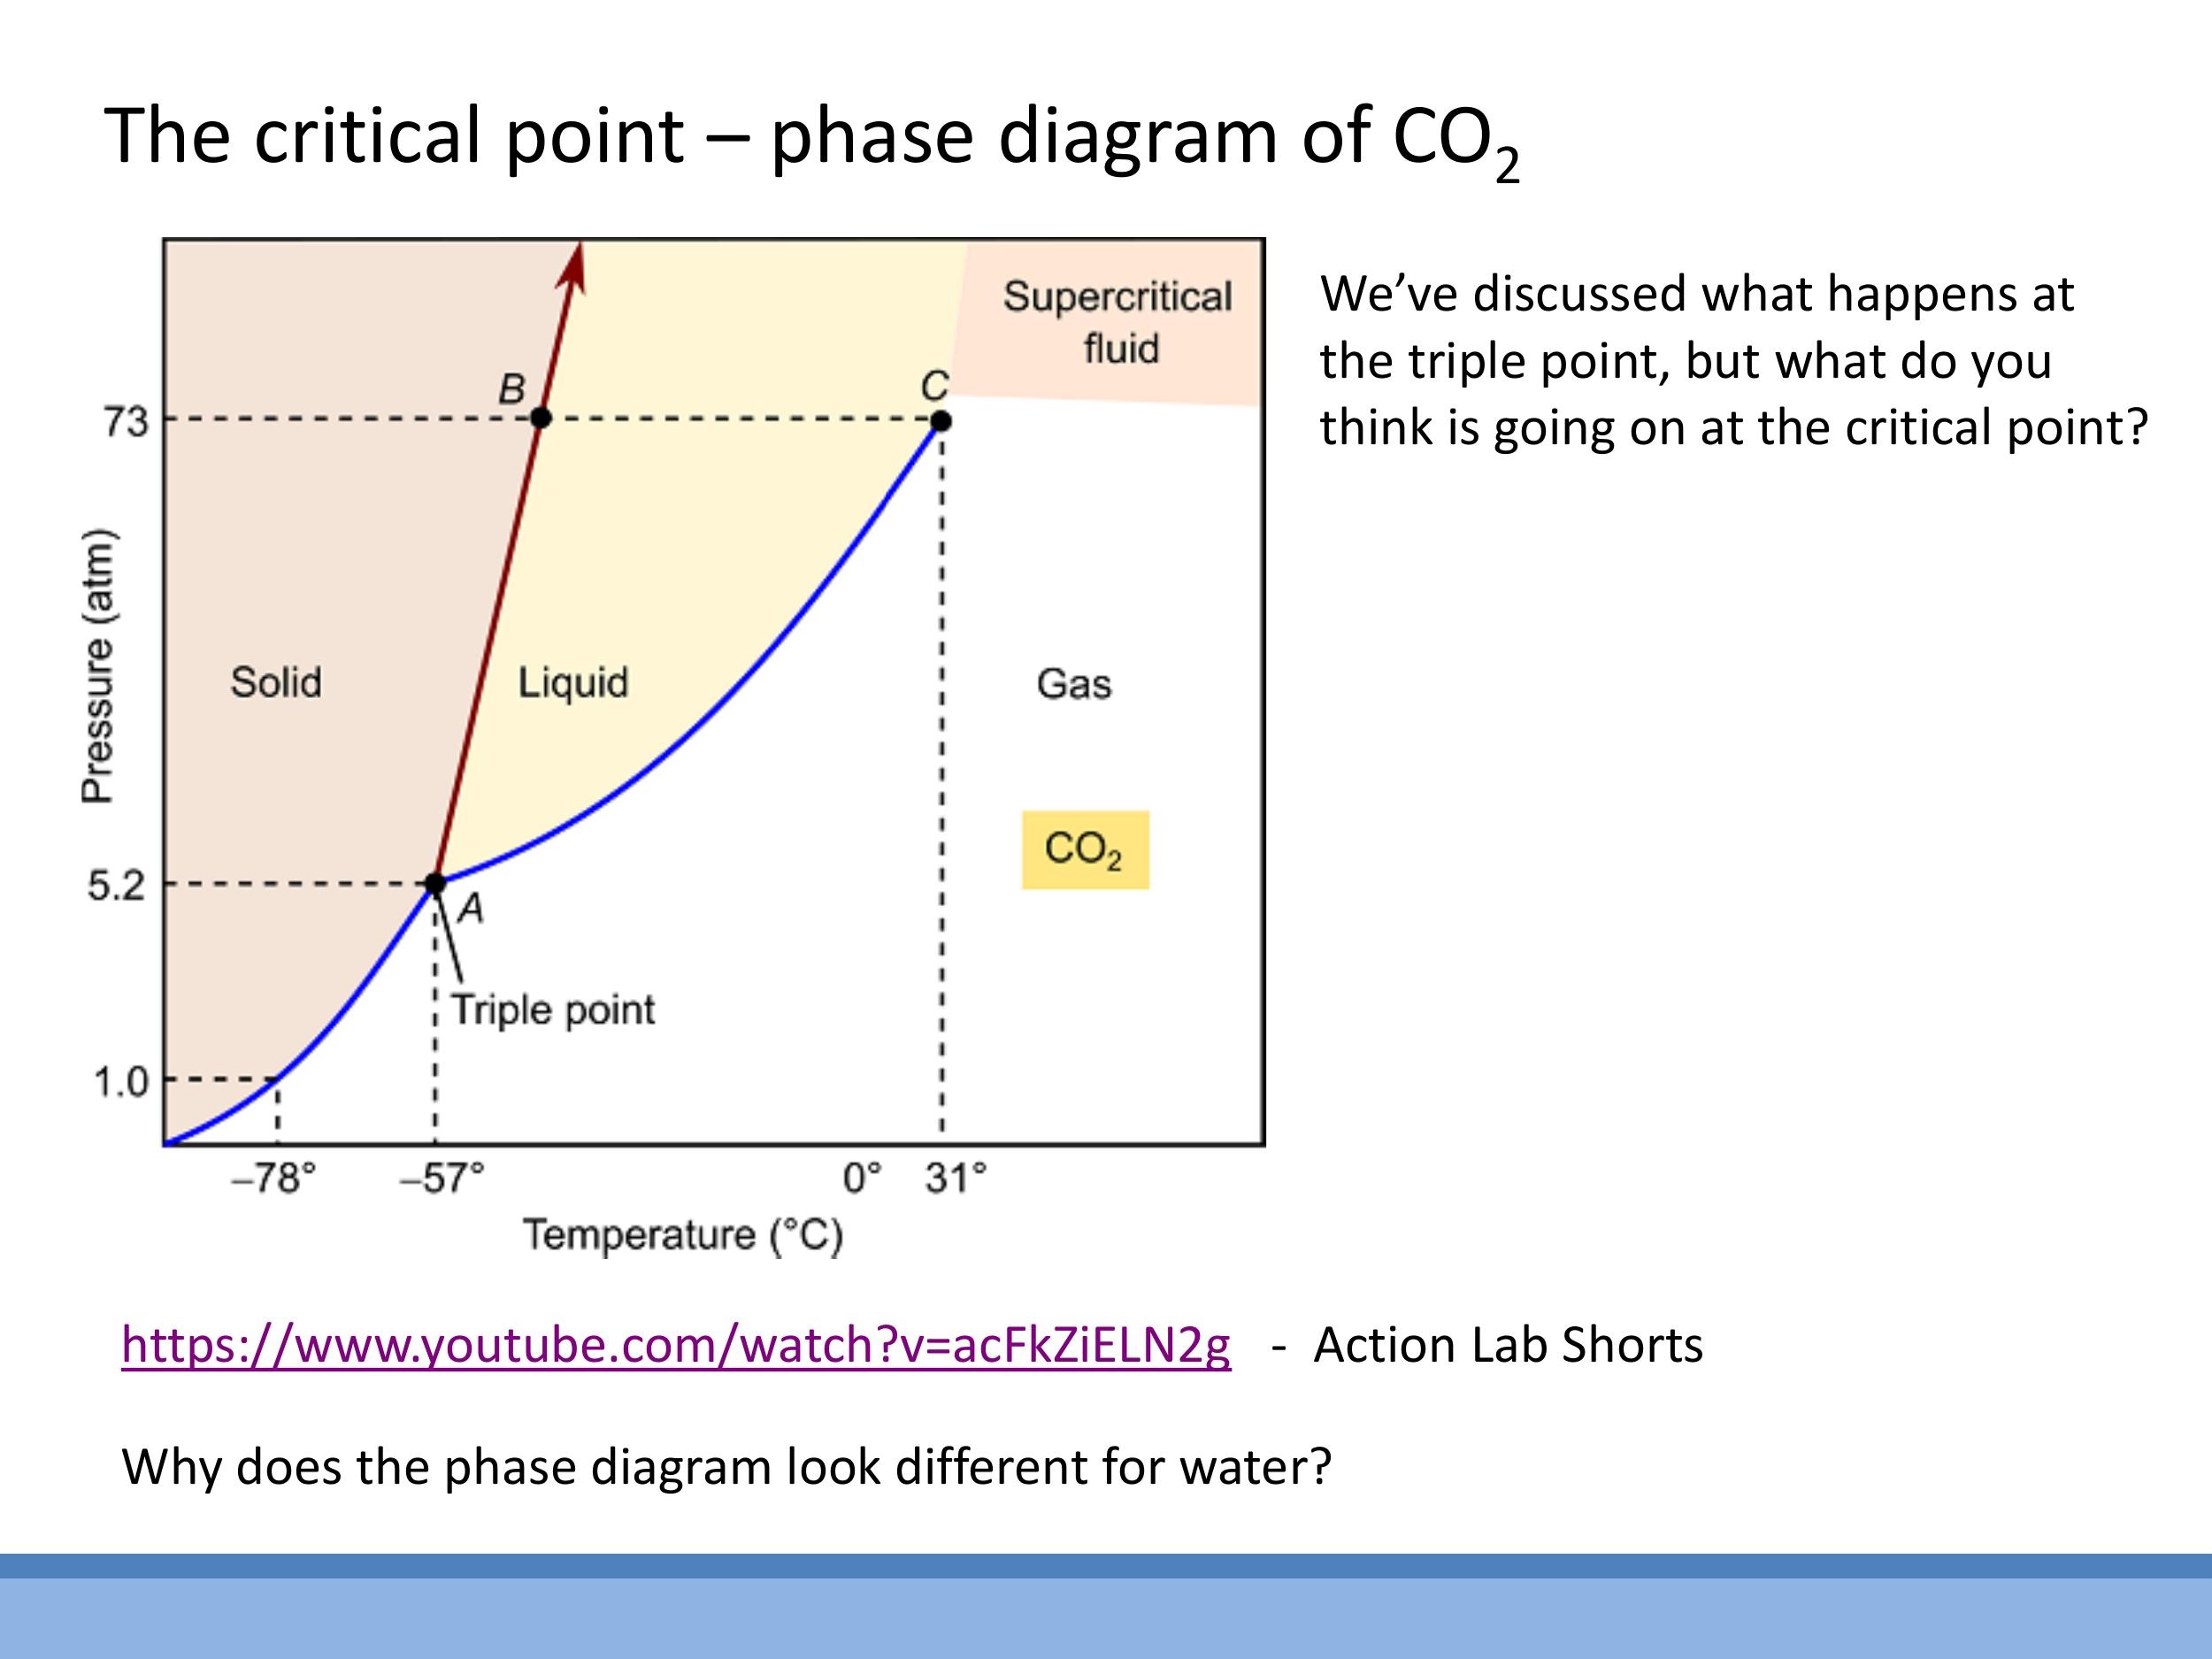
Phase diagrams, typically plotted as Pressure-Temperature ($P$ - $T$) graphs, provide a comprehensive overview of the stable phases of a substance under varying conditions. For substances like carbon dioxide ($\text{CO}_2$), these diagrams show distinct regions for solid, liquid, and gas phases, separated by phase boundaries. The triple point is a unique $(P, T)$ combination where all three phases coexist in thermodynamic equilibrium. The critical point ($T_C, P_C$) marks the end of the liquid-gas phase boundary. Beyond this point, the distinction between liquid and gas vanishes.
Above the critical temperature and pressure, a substance exists as a supercritical fluid
Water exhibits an anomalous phase diagram compared to most substances. While typical substances have a solid-liquid boundary with a positive slope (increasing pressure favours the denser solid phase), water's solid-liquid boundary has a negative slope
Appendix: Locating the critical point from the vdW isotherm (outline only)
Side Note: This material is supplementary and won't be examined, but provides useful context.
The critical point on a van der Waals isotherm corresponds to a point of inflection with a horizontal tangent. This means that at the critical point, both the first and second derivatives of pressure with respect to volume are zero: $\frac{dP}{dV} = 0$ and $\frac{d^2P}{dV^2} = 0$. Solving these two simultaneous equations for the van der Waals equation allows for the determination of the critical volume ($V_C$), critical pressure ($P_C$), and critical temperature ($T_C$) in terms of the van der Waals constants $a$ and $b$. This algebraic derivation is often explored in problems classes.
Key takeaways
Real gases deviate from ideal gas behaviour because molecules are not point-like and do interact through attractive forces. These effects are accounted for in the van der Waals equation by correcting the volume term to $V - nb$ and the pressure term to $P + a\left(\frac{n}{V}\right)^2$. The finite-size correction term $b$ arises from the excluded volume of hard spheres, approximated as $b = \frac{2}{3} N_A \pi d^3$, with units of $\text{m}^3 \, \text{mol}^{-1} $. The attraction correction term $ a$ adjusts the measured wall pressure, as molecules near the wall experience a net inward pull, and this pressure reduction scales quadratically with number density.
Van der Waals isotherms predict an S-shaped loop at low temperatures, an unphysical region that corresponds to gas-liquid coexistence. The Maxwell construction addresses this by replacing the loop with a constant-pressure plateau, representing the phase transition. In this region, liquid forms upon compression, and liquids are nearly incompressible, resulting in a very steep pressure rise at small volumes. The critical isotherm, occurring at the critical temperature ($T_C$), is the point where the loop disappears; above $T_C$, a gas cannot be liquefied by compression alone. Physically, $T_C$ is linked to the intermolecular binding energy $\varepsilon$ by the relationship $kT_C \sim \varepsilon$.
Pressure-Temperature phase diagrams summarize the stable phases and their boundaries. They feature a triple point, where solid, liquid, and gas coexist, and a critical point ($T_C, P_C$), which marks the end of the liquid-gas boundary. Beyond the critical point, the substance exists as a supercritical fluid, a dense fluid where liquid and gas phases are indistinguishable. Water exhibits an anomalous phase diagram where the solid-liquid boundary has a negative slope, meaning increasing pressure can melt ice due to its lower density compared to liquid water.
## Lecture 8: Real Gases
### 0) Orientation, quick review, and assessment guidance

This lecture builds upon the previous discussion of specific heat capacities for ideal gases. For a monatomic ideal gas, the equipartition theorem dictates an average molar internal energy of $\frac{3}{2}RT$, leading to a molar specific heat at constant volume, $C_V = \frac{3}{2}R$. The molar specific heat at constant pressure, $C_P$, is related by Mayer's relation, $C_P = C_V + R = \frac{5}{2}R$. Consequently, the ratio of specific heats, $\gamma = \frac{C_P}{C_V} = \frac{5}{3}$. Noble gases experimentally exhibit $C_V$ values very close to $\frac{3}{2}R$, confirming their near-ideal behaviour. Today's focus is to understand why the ideal gas assumptions fail for real gases and how these failures are addressed through models like the van der Waals equation and the virial form. We will explore how isotherms reveal phase changes, introduce the critical point, and define supercritical fluids. For assessment purposes, complex real-gas formulae and numerical values will be provided; the emphasis will be on recognizing the underlying physics and performing straightforward substitutions to derive numerical results.
### 1) What breaks in the ideal gas model, and what does it change?
The ideal gas model relies on two primary idealizations that break down for real gases. Firstly, it assumes no intermolecular forces, implying particles do not interact. In reality, gas molecules experience both attractive and short-range repulsive forces. Secondly, the model treats particles as point-like entities with negligible volume. In physical systems, atoms and molecules possess finite size.
These failing assumptions have significant consequences for the macroscopic state variables of a gas. For pressure, intermolecular attractive forces reduce the momentum transferred to the container walls. Molecules near the wall experience a net inward pull from their neighbours in the bulk, causing them to strike the wall with less force than they would in the absence of attraction. This results in a measured pressure ($P$) that is lower than the theoretical pressure of an ideal gas under similar conditions. For volume, the finite size of molecules means that the actual space available for molecular motion is less than the total container volume ($V$). This "excluded volume" effect necessitates replacing the total volume with an effective available volume that is smaller than the container volume.
### 2) Modelling real gases: van der Waals and the virial view

The van der Waals (vdW) equation provides a physically intuitive model for real gases by introducing corrections to the ideal gas law:
$$ \left( P + \frac{n^2 a}{V^2} \right) (V - nb) = nRT $$
Here, the term $\frac{n^2 a}{V^2}$ corrects for intermolecular attraction by increasing the effective pressure, while the term $nb$ corrects for the finite size of molecules by reducing the available volume. For context, the virial equation offers an empirical alternative, expressed as a power series expansion:
$$ \frac{PV}{RT} = 1 + \frac{B}{V} + \frac{C}{V^2} + \dots $$
The coefficients $B$, $C$, and so on are determined by fitting to experimental data. This series approaches 1 as the volume ($V$) tends to infinity, indicating ideal gas behaviour at low densities.
Experimental data for real gases, when plotted as $\frac{PV}{RT}$ versus $P$ (for one mole), reveal significant deviations from the ideal gas value of 1. At low pressures, real gases approximate ideal behaviour, but at higher pressures (and lower temperatures), intermolecular forces and finite molecular size become dominant, causing $\frac{PV}{RT}$ to deviate. Different gases exhibit distinct deviation curves. Both the van der Waals and virial equations correctly predict that at low densities (high $V$) or high temperatures ($T$), the correction terms become negligible, and the equations reduce to the ideal gas law, $PV = nRT$.
### 3) Finite-size correction (b): the excluded volume

The finite-size correction term, $b$, accounts for the volume occupied by the gas molecules themselves, effectively reducing the available volume for other molecules to move in. This can be conceptualized by treating molecules as hard spheres of diameter $d$. When two such spheres are in contact, the centre of one molecule cannot enter a spherical region of radius $d$ around the centre of the other. This volume represents the "excluded volume" for a pair of molecules.
To calculate $b$ per mole, the excluded volume for a single pair is $\frac{4}{3}\pi d^3$. However, since each excluded volume is shared between two interacting molecules, a factor of $\frac{1}{2}$ is introduced to avoid double-counting. Thus, the excluded volume per molecule is $\frac{1}{2} \times \frac{4}{3}\pi d^3 = \frac{2}{3}\pi d^3$. Multiplying this by Avogadro's number ($N_A$) yields the molar correction term:
$$ b = \frac{2}{3} N_A \pi d^3 $$
The units of $b$ are typically $\text{m}^3\,\text{mol}^{-1}$. For example, Argon has a reported $b$ value of approximately $3.2 \times 10^{-5}\,\text{m}^3\,\text{mol}^{-1}$. This term underpins the intuition that the actual free volume for molecular motion is $V - nb$, where $nb$ is the total volume inaccessible due to the finite size of $n$ moles of gas.
### 4) Attraction correction (a): why the wall pressure is lower

The correction term $a$ in the van der Waals equation accounts for the attractive intermolecular forces that reduce the measured pressure exerted by a real gas. In the bulk of the gas, the attractive forces experienced by any given molecule from its neighbours tend to cancel out in all directions. However, a molecule approaching the container wall experiences a net inward pull from the molecules behind it, as there are no molecules beyond the wall to exert an opposing attractive force. This net inward force reduces the momentum with which the molecule strikes the wall.
The reduction in pressure, $\Delta P$, is proportional to two factors: the number density of molecules hitting the wall, and the number density of molecules in the bulk exerting the attractive pull. Both of these are proportional to the number density of the gas, $\frac{n}{V}$. Therefore, the pressure reduction scales quadratically with density: $\Delta P \propto \left(\frac{n}{V}\right)^2$. This justifies the van der Waals pressure correction, where the measured pressure $P$ is effectively increased by $a\left(\frac{n}{V}\right)^2$ to represent the ideal pressure, leading to the term $P + a\left(\frac{n}{V}\right)^2$. The constant $a$ scales the magnitude of this attractive effect for a specific gas.
### 5) Reading P-V isotherms: ideal vs real, and what “loops” really mean


Pressure-Volume ($P$-$V$) isotherms illustrate the relationship between pressure and volume at a constant temperature. For ideal gases, these isotherms are smooth hyperbolae. However, van der Waals isotherms for real gases deviate significantly, especially at lower temperatures. At high temperatures, real-gas isotherms resemble ideal-gas curves. As the temperature decreases, van der Waals isotherms develop a characteristic S-shaped loop, which includes regions where $\frac{dP}{dV} > 0$ (pressure increases with volume) or even negative pressure, both of which are physically impossible for a single gaseous phase.
This unphysical loop signals the onset of a phase change, specifically condensation from gas to liquid. Within this region, the substance exists as a mixture of gas and liquid in equilibrium. Instead of representing a gas with increasing pressure upon expansion, the loop corresponds to compression at a fixed temperature, where gas converts into liquid at a constant pressure. On the small-volume side of the isotherm, the curve becomes very steep, reflecting the near-incompressibility of the liquid phase.
To resolve the unphysical loop, the Maxwell construction (or equal-area rule) is applied. This replaces the S-shaped portion of the isotherm with a horizontal line, or plateau, at the phase-change pressure. The position of this line is chosen such that the area between the van der Waals curve and the horizontal line above the plateau is equal to the area below it. This corrected isotherm then clearly delineates three regions: the gas phase at large volumes (following the van der Waals curve), the gas-liquid coexistence region at constant pressure (the flat plateau), and the liquid phase at small volumes (exhibiting a very steep pressure rise due to incompressibility). Condensation is favoured at low temperatures, which is why the loop becomes more pronounced, whereas high temperatures "wash out" this behaviour, leading to ideal-like isotherms.
### 6) The critical isotherm and the scale $T_C \sim \varepsilon/k$

As temperature increases, the unphysical S-shaped loop on the van der Waals isotherms progressively shrinks. At a specific temperature, known as the **critical temperature** ($T_C$), the loop disappears entirely, collapsing into a single point of inflection with a horizontal tangent. This unique isotherm is called the **critical isotherm**. Above $T_C$, compression alone cannot cause the gas to condense into a liquid; instead, the substance transitions smoothly from a gas-like to a liquid-like state without a distinct phase boundary.
The critical temperature provides a crucial link between macroscopic thermodynamic behaviour and microscopic intermolecular forces. At $T_C$, the average thermal energy of the molecules, $kT$, becomes comparable to the intermolecular binding or separation energy, $\varepsilon$. This relationship can be expressed as $T_C \sim \frac{\varepsilon}{k}$. This connection reinforces earlier concepts where $\varepsilon$ was inferred from latent heats and neighbour counting, demonstrating that the same energy scale governs both microscopic bond strength and the macroscopic critical point. The P-V diagram clearly shows the gas, coexistence, and liquid regions relative to this critical isotherm, with the critical point marking the end of the gas-liquid phase boundary.
### 7) Phase diagrams: triple point, critical point, and supercritical fluids


Phase diagrams, typically plotted as Pressure-Temperature ($P$-$T$) graphs, provide a comprehensive overview of the stable phases of a substance under varying conditions. For substances like carbon dioxide ($\text{CO}_2$), these diagrams show distinct regions for solid, liquid, and gas phases, separated by phase boundaries. The **triple point** is a unique $(P, T)$ combination where all three phases coexist in thermodynamic equilibrium. The **critical point** ($T_C, P_C$) marks the end of the liquid-gas phase boundary. Beyond this point, the distinction between liquid and gas vanishes.
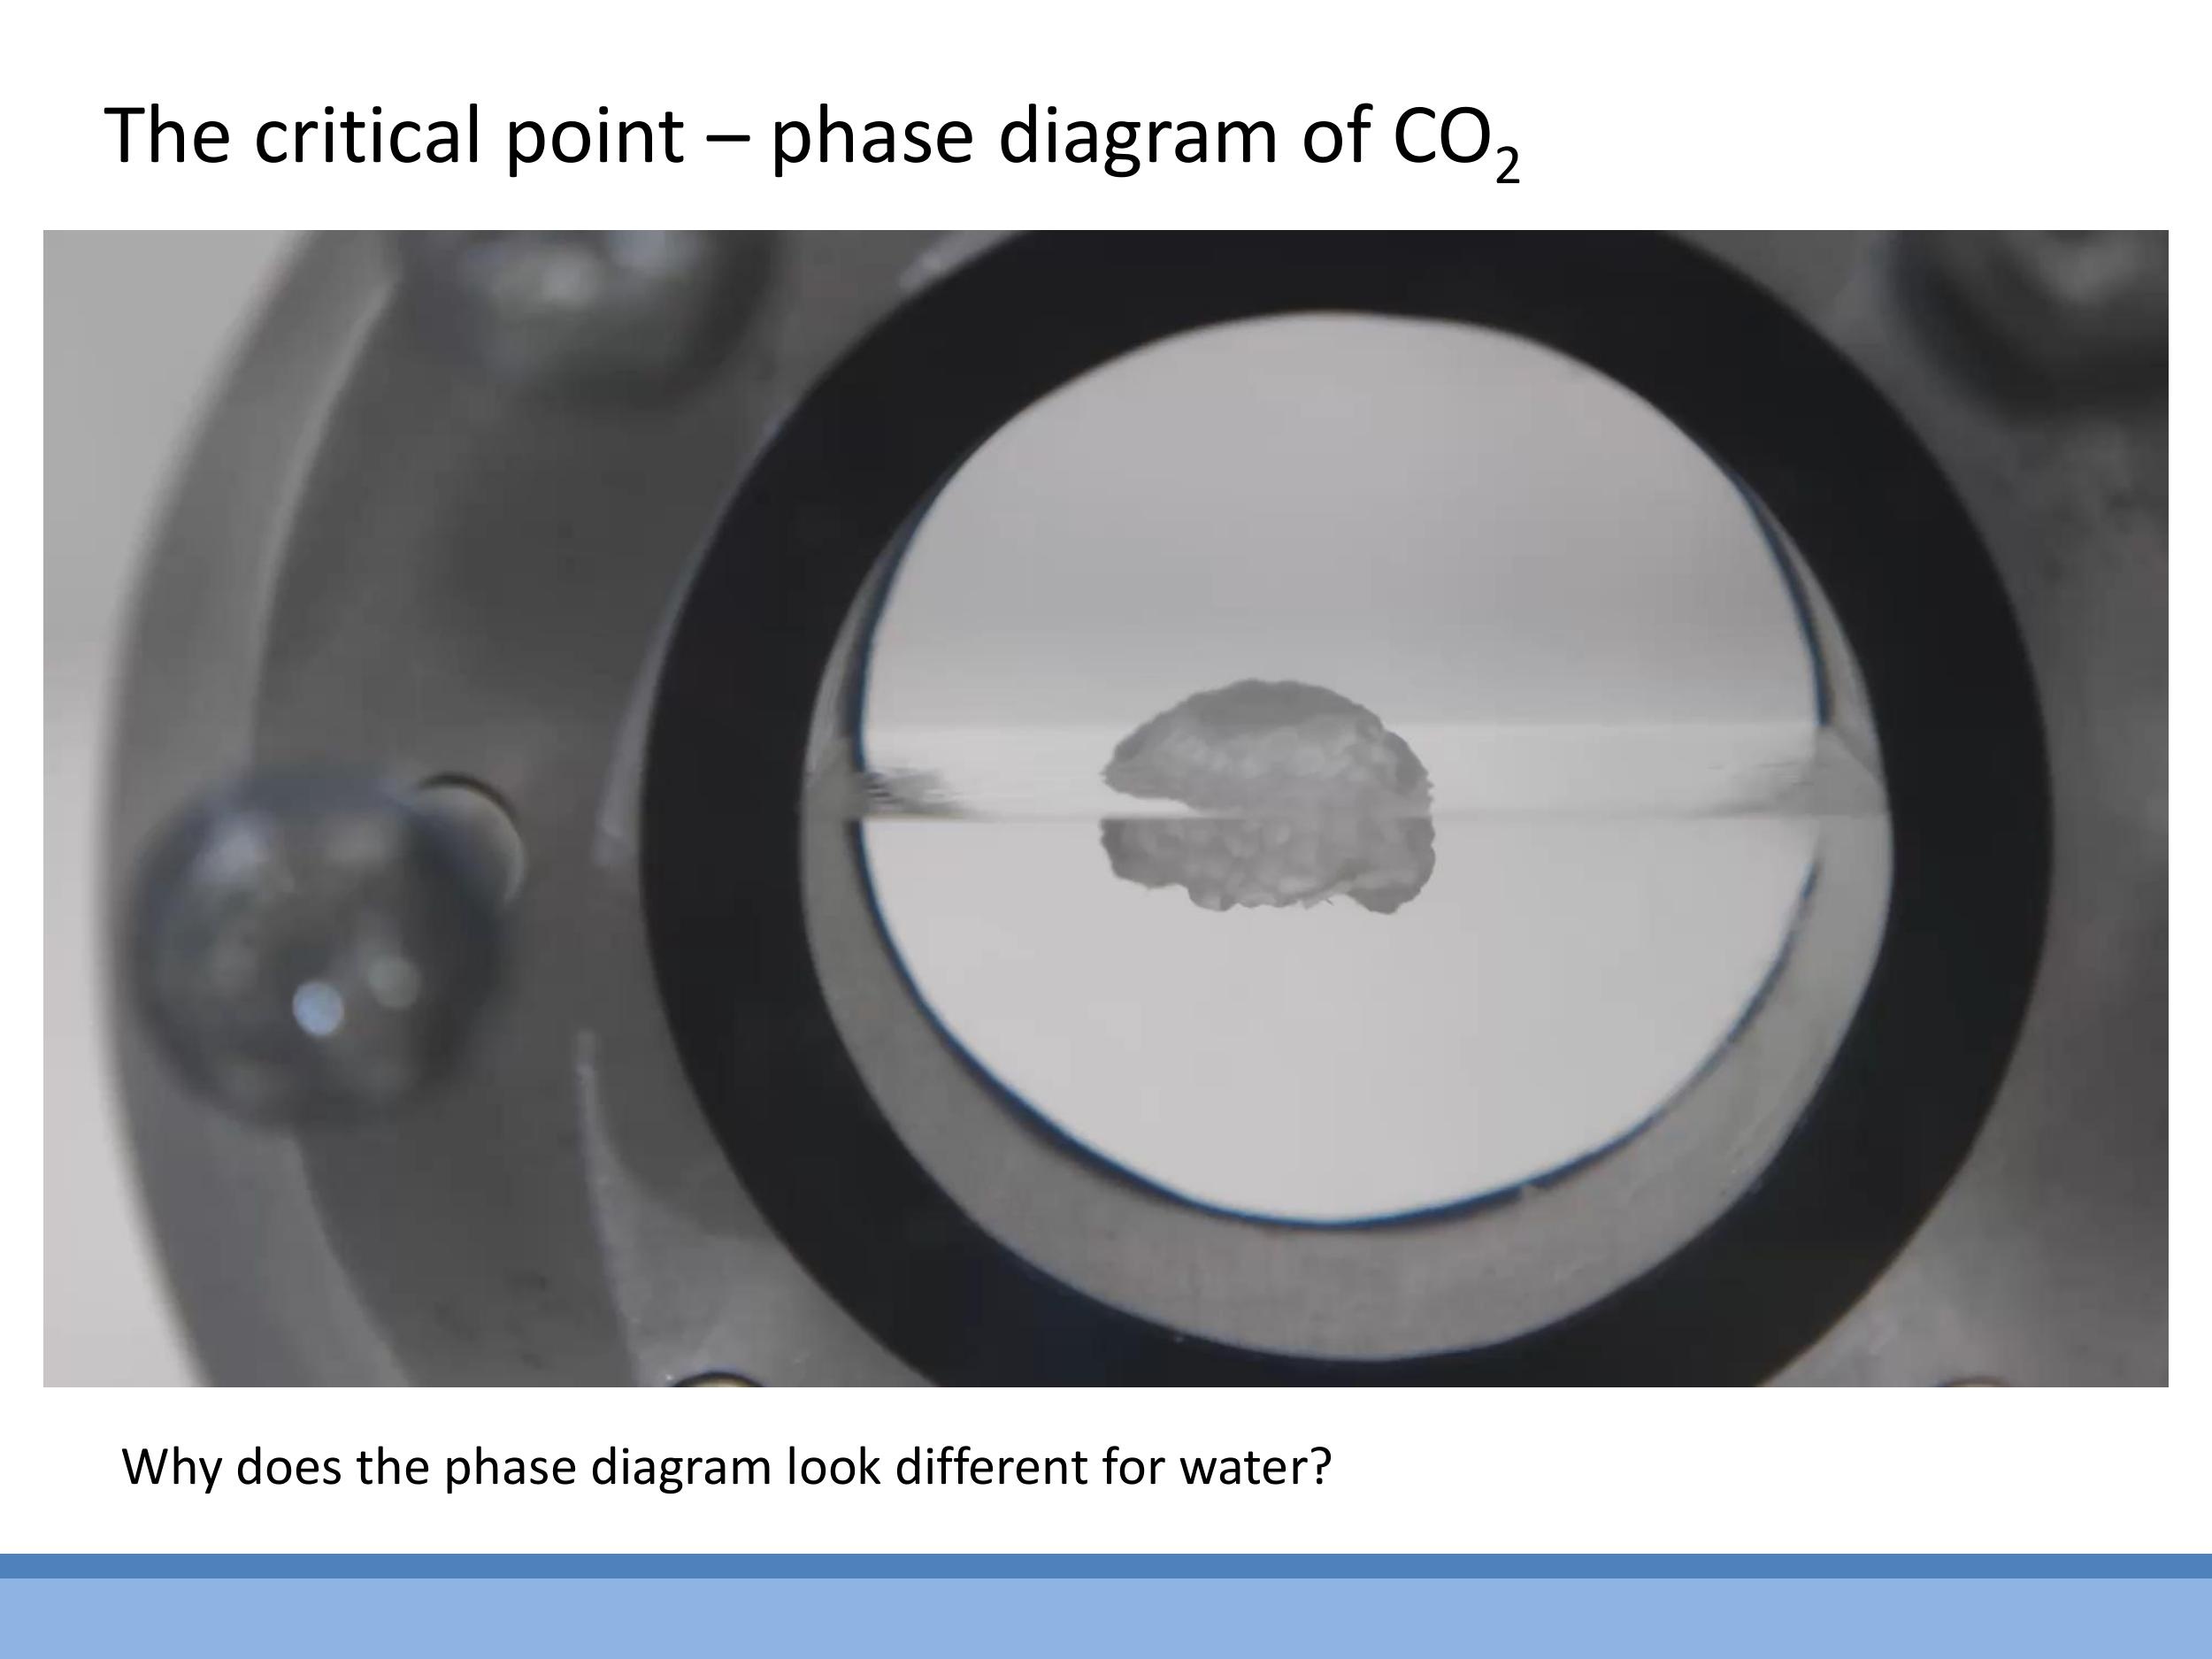
Above the critical temperature and pressure, a substance exists as a **supercritical fluid**. This state is characterized by properties intermediate between a gas and a liquid: it behaves as a dense, viscous, "liquidy gas" with no visible meniscus separating distinct phases. A common demonstration involves heating liquid $\text{CO}_2$ in a sealed cell: as it crosses the critical temperature (around $31\,^\circ\text{C}$), the meniscus separating the liquid and gas phases fades and disappears, and a floating object may sink through the now-uniform supercritical fluid.
Water exhibits an anomalous phase diagram compared to most substances. While typical substances have a solid-liquid boundary with a positive slope (increasing pressure favours the denser solid phase), water's solid-liquid boundary has a **negative slope**. This is because liquid water is denser than ice; consequently, increasing pressure at a near-constant temperature can cause ice to melt.
### Appendix: Locating the critical point from the vdW isotherm (outline only)
*Side Note:* This material is supplementary and won't be examined, but provides useful context.
The critical point on a van der Waals isotherm corresponds to a point of inflection with a horizontal tangent. This means that at the critical point, both the first and second derivatives of pressure with respect to volume are zero: $\frac{dP}{dV} = 0$ and $\frac{d^2P}{dV^2} = 0$. Solving these two simultaneous equations for the van der Waals equation allows for the determination of the critical volume ($V_C$), critical pressure ($P_C$), and critical temperature ($T_C$) in terms of the van der Waals constants $a$ and $b$. This algebraic derivation is often explored in problems classes.
## Key takeaways
Real gases deviate from ideal gas behaviour because molecules are not point-like and do interact through attractive forces. These effects are accounted for in the van der Waals equation by correcting the volume term to $V - nb$ and the pressure term to $P + a\left(\frac{n}{V}\right)^2$. The finite-size correction term $b$ arises from the excluded volume of hard spheres, approximated as $b = \frac{2}{3} N_A \pi d^3$, with units of $\text{m}^3\,\text{mol}^{-1}$. The attraction correction term $a$ adjusts the measured wall pressure, as molecules near the wall experience a net inward pull, and this pressure reduction scales quadratically with number density.
Van der Waals isotherms predict an S-shaped loop at low temperatures, an unphysical region that corresponds to gas-liquid coexistence. The Maxwell construction addresses this by replacing the loop with a constant-pressure plateau, representing the phase transition. In this region, liquid forms upon compression, and liquids are nearly incompressible, resulting in a very steep pressure rise at small volumes. The critical isotherm, occurring at the critical temperature ($T_C$), is the point where the loop disappears; above $T_C$, a gas cannot be liquefied by compression alone. Physically, $T_C$ is linked to the intermolecular binding energy $\varepsilon$ by the relationship $kT_C \sim \varepsilon$.
Pressure-Temperature phase diagrams summarize the stable phases and their boundaries. They feature a triple point, where solid, liquid, and gas coexist, and a critical point ($T_C, P_C$), which marks the end of the liquid-gas boundary. Beyond the critical point, the substance exists as a supercritical fluid, a dense fluid where liquid and gas phases are indistinguishable. Water exhibits an anomalous phase diagram where the solid-liquid boundary has a negative slope, meaning increasing pressure can melt ice due to its lower density compared to liquid water.